Dollar Index Climbs to Its Highest Level Since May 2025: What the Hawkish Fed Means for USD
Vantage Editorial Team >
Vantage Editorial Team >
Vantage is a global, multi-asset broker with a team of in-house writers and market analysts who produce educational and insightful trading content for traders of all levels.
The US dollar index (USDX) reached 100.58 as of 01:39 UTC on 22 June 2026, its highest level since May 2025. The DXY has climbed roughly 1.5% from the week’s open, pulled higher by two back-to-back events: the Federal Reserve’s 17 June meeting, where the June dot plot shifted materially hawkish, with nine of eighteen participants projecting at least one rate hike in 2026, and the US-Iran interim peace agreement that took effect on 19 June. Market pricing ultimately suggested that the Fed’s hawkish shift outweighed the dollar-negative effects of easing geopolitical tensions.
All prices reference the Vantage DXY CFD. Chart data is from TradingView via the Vantage USDX CFD. This is not financial advice. Check out all trading CFDs available on Vantage Markets today.
Key Points
- The dollar index (USDX) touched 100.58 at 01:39 UTC on 22 June 2026, its highest level since May 2025, following the Fed’s hawkish June dot plot and a US-Iran peace framework that pushed oil prices sharply lower.
- Nine of 18 FOMC participants now project at least one rate hike in 2026, reversing the March median that called for cuts. New Fed Chair Kevin Warsh declined to submit a dot and stripped forward guidance from the policy statement.[1]
- US CPI rose 4.2% year-on-year in May, a three-year high, driven by energy. Core CPI held at 2.9%.[2] CME FedWatch data showed December 2026 hike odds falling to around 50% after the peace deal, down from nearly 70% the prior week.[3]
US Dollar Index Chart: What the 4H Setup Shows
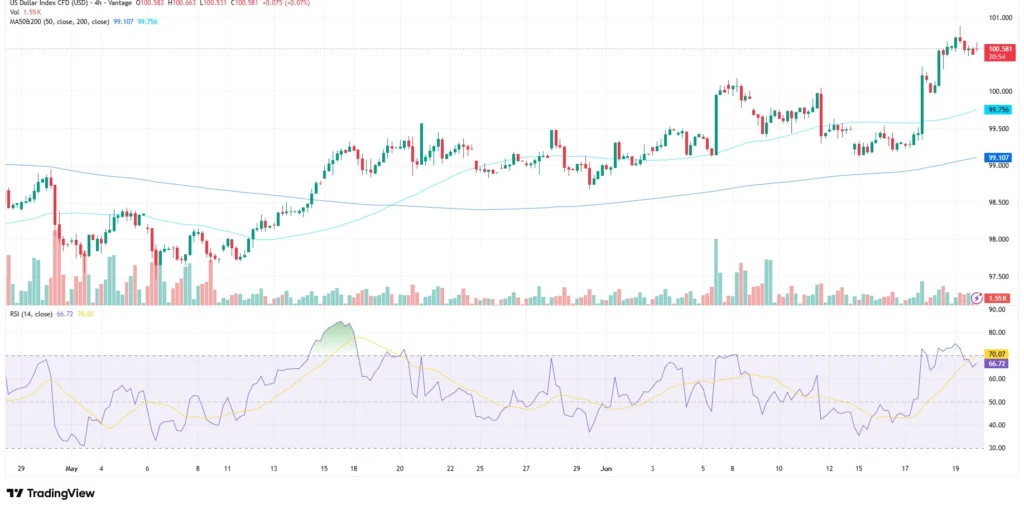
The 4H dollar index chart breaks into two clear phases. From late April through mid-May 2026, the USDX traded sideways between 98.00 and 99.50, with the 4H 50-period MA and 200-period MA both flat and nearly touching. The trend strengthened materially during the week of 18 May 2026, when the index broke above both moving averages on rising volume.
That momentum carried the DXY through 100 for the first time since early April 2026, aided by stronger-than-expected May 2026 non-farm payrolls data, which printed 172,000 against an 85,000 consensus.[4] The index softened into mid-June before the Fed decision on 17 June 2026 reignited the move. The 4H 50-period MA now sits at 99.107 and the 200-period MA at 99.756, both below current price and acting as reference support for traders monitoring the dollar index chart.
The RSI (14, close) on the TradingView setup used for this analysis reads 66.72 on the slow line and 70.07 on the fast line. The fast line is touching the overbought boundary. No close above 101 has printed on the 4H frame at time of writing.
Two Forces Driving the US Dollar Index Right Now
The Fed dot plot turns more hawkish
The 17 June 2026 FOMC vote was unanimous, 12-0, to hold rates at 3.50% to 3.75%.[1] Warsh’s first meeting as chair produced a dramatically shorter policy statement with no easing bias and no forward guidance. More telling was the dot plot: nine of 18 participants pencilled in at least one hike in 2026, against a March median that still showed cuts.
The median year-end 2026 Fed funds forecast shifted to 3.8% from 3.4%.[5] The June projections showed widespread concern about upside inflation risks among policymakers. Such concern about inflation risks may support a willingness to keep policy restrictive for longer, even if some members did not submit projections.
The Iran peace deal: relief offset by rate expectations
On 15 June 2026, the US and Iran agreed on a framework to end the conflict and allow Strait of Hormuz shipping to resume.[6] Brent fell more than 4% on the day. For the dollar, the deal cut in two directions: lower oil reduces inflation pressure and softens the urgency for hikes, weighing on the greenback.
CME FedWatch data showed December 2026 hike odds drop to around 50% from nearly 70%.[3] The DXY did pull back to a 10-day low on 15 June.[6] Two days later, the Fed’s hawkish dot plot reversed the move. Market participants appeared to place greater weight on the Fed’s hawkish policy outlook than on the disinflationary implications of lower oil prices.
Key Levels Across Major USD Pairs
Reference zones as of 01:39 UTC, 22 June 2026. Not trade signals.
| Pair | Support | Resistance | What traders are watching |
| DXY | 99.00 / 99.50 | 101.00 / 101.50 | Trading near its highest level since May 2025 (100.58); 4H 50-period MA 99.107 acting as near-term floor |
| EURUSD | 1.1400 / 1.1480 | 1.1660 / 1.1900 | Euro = 57.6% of DXY basket; ECB’s hike in June, Fed-ECB divergence in focus |
| USDJPY | 158.00 / 158.50 | 160.50 / 161.00 | BoJ hiked to 1.00%; Japan verbal intervention watch active above 160 |
| XAUUSD | 4,150 / 4,200 | 4,350 / 4,450 | Hawkish Fed + stronger DXY weighing on gold; Iran deal removed risk premium |
| USDMYR | 4.28 / 4.30 | 4.45 / 4.50 | Peace deal easing energy-driven MYR pressure; BNM stabilisation ongoing |
Table 1: Reference levels as of 01:39 UTC, 22 June 2026. Sources: TradingView, Reuters. Indicative only.
- EURUSD: The euro makes up 57.6% of the DXY basket, so dollar strength maps directly onto this pair. The ECB raised 25 basis points in June 2026; the Fed-ECB policy divergence is the primary driver as markets price a possible US rate hike against an ECB’s raise.
- USDJPY: The Bank of Japan hiked to 1.00% at its June 2026 meeting, but the US-Japan rate differential keeps yen under pressure. Japanese Finance Minister Satsuki Katayama has repeatedly stated readiness to intervene against speculative yen moves, with the 160 level closely watched by market participants.[7]
- XAUUSD: A firmer dollar index and a more hawkish Fed outlook reduced two key sources of support for gold. Traders monitoring the dollar index chart often track this pair alongside DXY given the inverse relationship.
What to Watch This Week
- Core PCE, US, 26 June 2026: The Fed’s preferred inflation measure. With the June projections showing widespread policymaker concern about upside inflation risks, a reading above 2.9% would reinforce the hawkish dot plot.
- US Q1 GDP (final), 26 June 2026: Confirms the growth backdrop the Fed weighed when holding rather than cutting.
- University of Michigan Inflation Expectations (June final), 27 June 2026: Consumer expectations feed Fed deliberations; an uptick adds to the hike case.
- Iran deal progress, Ongoing: The framework is signed but nuclear and sanctions talks continue. A breakdown would likely reignite oil prices and safe-haven dollar demand.
- Next FOMC, 29-30 July 2026: Markets will be watching whether incoming data tightens or widens the dot-plot split.
Risk Management Considerations
The dollar index has moved sharply on headlines this month. The Iran deal moved the USDX half a percent intraday on 15 June 2026; the Fed’s dot plot reversed that move and extended it within 48 hours. Standard range assumptions built on quieter sessions do not account for event-risk gaps of this size. Market participants watching the US dollar index often monitor the 99.00 to 99.50 zone as near-term reference support and 101.00 to 101.50 as the resistance area above current price. These are structural reference points, not trade signals.
Traders holding correlated positions across XAUUSD, USDJPY, and EURUSD commonly place Stop Loss levels around key structural zones to define maximum exposure ahead of scheduled data. Reviewing combined exposure across USD-correlated positions before high-impact releases such as Core PCE on 26 June 2026 is standard practice in volatile regimes.
Leverage amplifies both gains and losses. In headline-sensitive conditions where the dollar index can gap half a percent in minutes, position sizing relative to account equity is worth revisiting before the Core PCE and GDP releases on 26 June.

RISK WARNING: CFDs are complex financial instruments and carry a high risk of losing money rapidly due to leverage. You should ensure you fully understand the risks involved and carefully consider whether you can afford to take the high risk of losing your money before trading.
Disclaimer: The information is provided for educational purposes only and doesn’t take into account your personal objectives, financial circumstances, or needs. It does not constitute investment advice. We encourage you to seek independent advice if necessary. The information has not been prepared in accordance with legal requirements designed to promote the independence of investment research. No representation or warranty is given as to the accuracy or completeness of any information contained within. This material may contain historical or past performance figures and should not be relied on. Furthermore estimates, forward-looking statements, and forecasts cannot be guaranteed. The information on this site and the products and services offered are not intended for distribution to any person in any country or jurisdiction where such distribution or use would be contrary to local law or regulation.
References
[1] “Fed interest rate decision June 2026: Fed holds rates steady – CNBC” https://www.cnbc.com/2026/06/17/fed-interest-rate-decision-june-2026.html Accessed on 22 June 2026.
[2] “Consumer Price Index – May 2026 – US Bureau of Labor Statistics” https://www.bls.gov/news.release/cpi.nr0.htm Accessed on 22 June 2026.
[3] “Dollar hits 10-day low as US, Iran reach peace deal – Reuters via Investing.com” https://www.investing.com/news/economy-news/dollar-hits-10day-low-as-us-iran-reach-peace-deal-4741128 Accessed on 22 June 2026.
[4] “Dollar Index at 100: DXY Outlook for the Week of 8 June 2026 – Vantage Markets” https://www.vtg-mkt-apac.com/market-analysis/dollar-index-dxy-usdx-outlook-june-8-12-2026/ Accessed on 22 June 2026.
[5] “Fed Holds Rates June 2026; Dot Plot Flips to a Hike – StockTitan” https://www.stocktitan.net/articles/fed-rate-decision-june-17-2026 Accessed on 22 June 2026.
[6] “Gold drifts higher as Iran, US agree to halt war – CNBC” https://www.cnbc.com/2026/06/15/gold-gains-over-1percent-after-us-iran-reach-peace-deal.html Accessed on 22 June 2026.
[7] “Japan tempers yen warnings despite renewed slide towards key 160 level – Reuters via Investing.com” https://www.investing.com/news/economy-news/japan-tempers-yen-warnings-despite-renewed-slide-towards-key-160-level-4720833 Accessed on 22 June 2026.
[8] “June Fed Meeting: Updates and Commentary – Kiplinger” https://www.kiplinger.com/news/live/fed-meeting-updates-and-commentary-june-2026 Accessed on 22 June 2026.
[9] “Week Ahead: 22 June 2026 – IG” https://www.ig.com/ae/news-and-trade-ideas/week-ahead–22-june-2026-260619 Accessed on 22 June 2026.
