


[DAILY TRADING] USDJPY Analysis 6 July 2026 – Yen Holds 161.76 After 40-Year Low Scare

Vantage Editorial Team >
Vantage Editorial Team >
Vantage is a global, multi-asset broker with a team of in-house writers and market analysts who produce educational and insightful trading content for traders of all levels.
 Updated Mon, 2026 July 6 06:51
![[DAILY TRADING] USDJPY Analysis 6 July 2026 – Yen Holds 161.76 After 40-Year Low Scare](https://www.vtg-mkt-apac.com/wp-content/uploads/2026/06/usdjpy_hero-1.webp)
The Vantage USDJPY CFD (USD/JPY) traded near 161.761 as of 02:25 (GMT+8) on 6 July 2026 (18:25 UTC on 5 July), little changed and similar to prevailing spot market quotations. The pair has spent the past few days consolidating after reaching its strongest dollar level against the yen since 1986, with traders weighing a softer US jobs report against renewed signals from Japanese officials over currency intervention.
Prices below are attributed to the Vantage USDJPY CFD and the TradingView setup used for this analysis, accurate as of the stated cut-off.
Key points
- The live USDJPY price held near 161.761 as of 02:25 (GMT+8) on 6 July 2026, consolidating after the pair reached its strongest dollar level against the yen since 1986 earlier in the week.
- June’s US Non-Farm Payrolls report showed a seasonally adjusted 57,000 jobs added, well below the 115,000 consensus forecast, and the unemployment rate eased to 4.2%.
- Japan’s Ministry of Finance is reportedly shifting toward unannounced intervention tactics after a record ¥11.73 trillion defence of the yen between late April and late May did not hold. See all latest USDJPY news here.
What the chart is showing
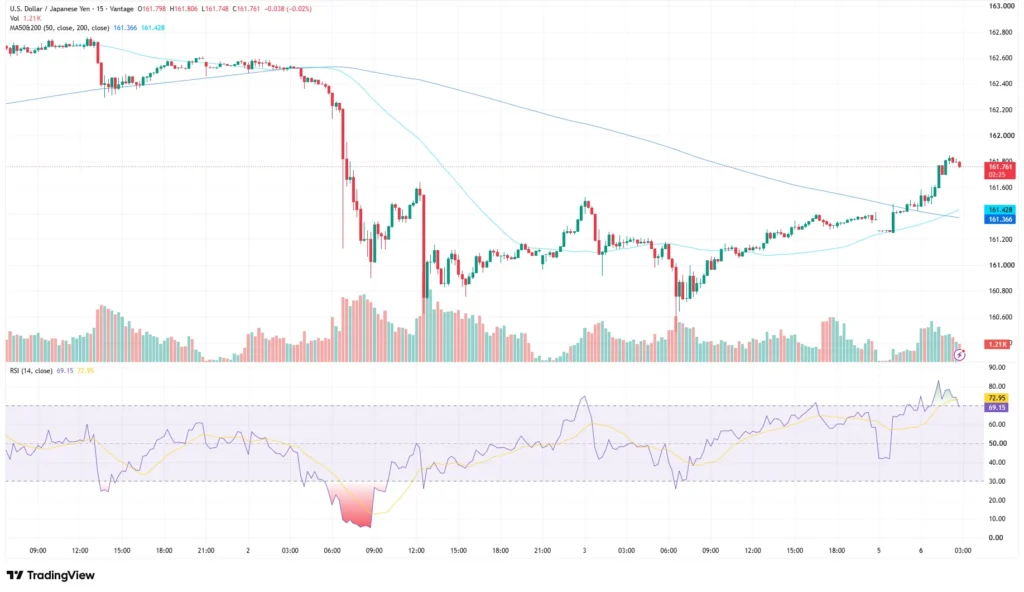
The 15-minute chart opened the week lower from around 162.60 before a sharp decline took the pair to an intraday low near 160.85. The drop coincided with the June jobs report on 2 July 2026 and pushed the 14-period RSI into oversold territory, near 10 at the low.
USDJPY has since recovered in stages: a choppy rebound toward 161.60, a shallower pullback into the 160.90 to 161.00 zone, then a steadier climb through 5 and 6 July 2026 back above 161.70. The session high of 161.806 ran into resistance just below 161.80 to 161.90.
The 50-period moving average last read 161.366 and the 200-period moving average read 161.428, per the TradingView setup used for this analysis, with price trading above both after the latest leg higher. The 14-period RSI last printed at 69.15, with its moving average at 72.95, putting momentum close to overbought after the recovery from deeply oversold conditions earlier in the week.
Why the yen is back in focus

The Bank of Japan raised its policy rate to 1% on 16 June 2026, its highest since 1995, continuing the gradual normalisation path it began in 2024.[1] The rate gap against the Fed’s 3.50% to 3.75% range, held at the June meeting, has stayed wide enough to keep yen-funded carry positioning in place, and the currency kept drifting toward multi-decade lows through late June.[5]
Japan’s Ministry of Finance spent a record ¥11.73 trillion, roughly $72 billion to $74 billion, defending the yen between 30 April and 27 May, per official ministry figures, but the boost was fully unwound within weeks.[1] Reuters reported on 2 July that officials are moving away from telegraphing intervention plans in advance, favouring unannounced action to raise the cost of short-yen positioning.[2] Finance Minister Satsuki Katayama has repeatedly said Tokyo stands ready to take appropriate and decisive action on excessive currency moves, without naming a specific trigger level.[2]
On the US side, the Bureau of Labor Statistics reported June 2026 Non-Farm Payrolls rose by 57,000, below the 115,000 consensus and down from a downwardly revised 129,000 in May, while unemployment eased to 4.2% and average hourly earnings rose 0.3% on the month.[4] The softer print pulled short-term Treasury yields lower and reduced expectations for a near-term Fed rate hike, coinciding with the yen’s rebound from its intraday low.[3] The BoJ’s latest tankan survey showed business sentiment at an eight-year high and corporate inflation expectations at record levels, keeping the case for further BoJ tightening on the table.[2]

Levels traders are watching
The table below covers the reference zones currently in focus on the Vantage USDJPY (USD to JPY) CFD chart. These are levels traders are watching, not trade signals.
| Pair | Support | Resistance | What is happening |
| USDJPY | 161.10 / 160.85 | 161.80 / 162.00 | Trading near 161.76, consolidating below the past week’s high |
Table 1: Key USDJPY levels as of 6 July 2026. Source: Vantage USDJPY CFD chart, TradingView. Indicative only.
What to watch next
- Federal Reserve meeting, 29 July 2026: the first opportunity for policymakers to formally assess June’s weaker-than-expected employment report alongside incoming inflation data.[6]
- Signs of Japanese intervention: with officials favouring unannounced action, a sharp, high-volume USDJPY move without an obvious data trigger is worth noting.[2]
- Bank of Japan commentary: further remarks on the inflationary impact of a weak yen, following recent comments from Deputy Governor Ryozo Himino.[2]
Given how sharply USDJPY has moved around headlines this week, from the oversold spike near 160.85 to the recovery above 161.70, standard intraday range assumptions have been less reliable than usual. Stop Loss placement around the 161.10 support and the 161.80 to 162.00 resistance band matters more than usual here, and traders holding other yen pairs should check combined exposure, since intervention-driven moves can affect several pairs at once.
Leverage works both ways in this kind of headline-driven, two-way market and remains a double-edged tool, not an advantage. Position sizing relative to account equity is worth revisiting ahead of the next Fed meeting and any potential Japanese currency market action.

RISK WARNING: CFDs are complex financial instruments and carry a high risk of losing money rapidly due to leverage. You should ensure you fully understand the risks involved and carefully consider whether you can afford to take the high risk of losing your money before trading.
Disclaimer: The information is provided for educational purposes only and doesn’t take into account your personal objectives, financial circumstances, or needs. It does not constitute investment advice. We encourage you to seek independent advice if necessary. The information has not been prepared in accordance with legal requirements designed to promote the independence of investment research. No representation or warranty is given as to the accuracy or completeness of any information contained within. This material may contain historical or past performance figures and should not be relied on. Furthermore estimates, forward-looking statements, and forecasts cannot be guaranteed. The information on this site and the products and services offered are not intended for distribution to any person in any country or jurisdiction where such distribution or use would be contrary to local law or regulation.
References
[1] “Japan yen falls to lowest level since 1986, keeping intervention risks in focus – CNBC” https://www.cnbc.com/2026/06/30/japan-yen-falls-lowest-level-since-1986-dollar-intervention-risk.html Accessed on 6 July 2026.
[2] “Exclusive-Japan shifts to ambush intervention tactics against yen short sellers, sources say – Reuters (via Investing.com)” https://www.investing.com/news/economy-news/exclusivejapan-shifts-to-ambush-intervention-tactics-against-yen-short-sellers-sources-say-4772275 Accessed on 6 July 2026.
[3] “Jobs report June 2026: US economy added 57,000 jobs in June, less than expected – CNBC” https://www.cnbc.com/2026/07/02/jobs-report-june-2026-.html Accessed on 6 July 2026.
[4] “Employment Situation Summary – June 2026 – US Bureau of Labor Statistics” https://www.bls.gov/news.release/empsit.nr0.htm Accessed on 6 July 2026.
[5] “June 16-17, 2026 FOMC Meeting – Board of Governors of the Federal Reserve System” https://www.federalreserve.gov/monetarypolicy/fomcpresconf20260617.htm Accessed on 6 July 2026.
[6] “Calendar: July 2026 – Board of Governors of the Federal Reserve System” https://www.federalreserve.gov/newsevents/2026-july.htm Accessed on 6 July 2026.