WTI Below $100.5: Crude Oil Prices React to Iran Deal Talks
Vantage Editorial Team >
Vantage Editorial Team >
Vantage is a global, multi-asset broker with a team of in-house writers and market analysts who produce educational and insightful trading content for traders of all levels.

WTI crude oil (USOUSD) briefly broke below $100.5 on 20 May 2026 for the first time in weeks. Brent crude oil (UKOUSD) fell more than 5% the same session. Both benchmarks are now near $101.98 and $106.31 respectively as of 01:50 (UTC) on 21 May 2026.
The catalyst was a single comment. US President Trump told reporters the country was in the “final stages” of talks with Iran.[1] On the same day, satellite data showed three supertankers crossing the Strait of Hormuz, a development traders interpreted as a tentative sign that transit risks may be easing.[2] Crude oil prices today reflect a market repricing the probability of a deal, not a done deal. Both benchmarks partially recovered overnight.
This article runs through the oil price chart for both WTI and Brent, what drove the move, and what to watch going into next week. All prices are as of 01:50 (UTC) on 21 May 2026. Charts are from TradingView and are indicative only. This is not financial advice.
Key Points
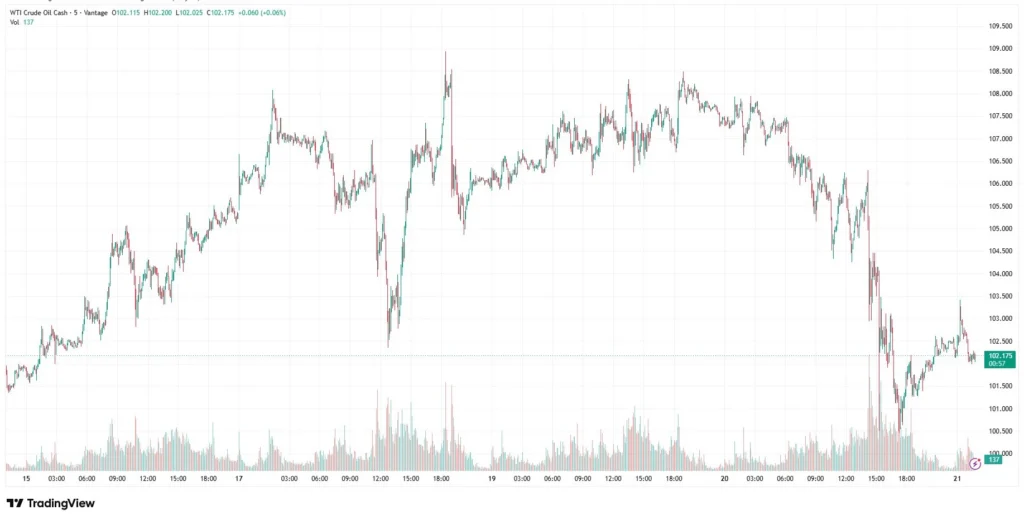
- WTI (USOUSD) closed at $102.53 on 20 May after breaking below $100.5 intraday, its lowest close in weeks, before recovering toward $102.22 by the 21 May open.[1]
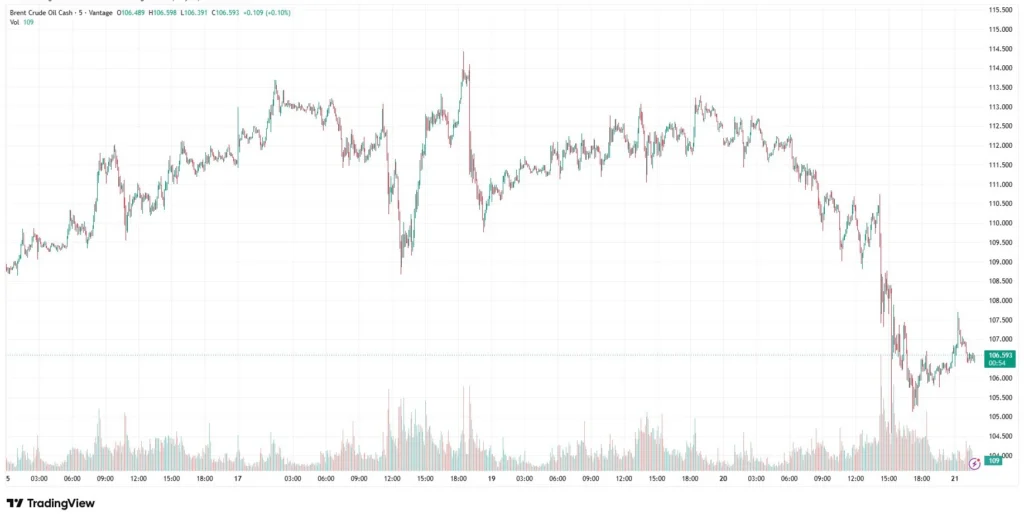
- The Brent crude oil price (UKOUSD) fell from a weekly high near $114 on 18 May to close around $105.27 on 20 May, an approximate $9 range in under 48 hours, before recovering to $106.31 overnight.[2]
- The IEA confirmed global observed inventories fell by 250 million barrels across March and April (4 mb/d), while the EIA projects Q2 2026 inventory draws averaging 8.5 mb/d as the supply-demand gap widens.[3][4] Total production losses since February have reached 12.8 mb/d.[3]
What the oil price chart is showing
WTI crude oil (USOUSD): $100 broken, activity accelerated on the drop
The WTI oil price chart shows a steady climb from the week’s open near $106.21 to a high around $108.94 on 18–19 May, then a sharp reversal on 20 May that briefly pushed below $100.5 before closing at $102.53.[1] Trading activity accelerated sharply during the selloff, which is visible in the volume histogram at the base of the chart, confirming this was not thin-market noise. The $100 level held on a closing basis. WTI has since recovered toward $102.22.
Brent oil (UKOUSD): $114 to $105 in one session, buyers returned at $104.50
The Brent crude oil price (UKOUSD) opened the week near $112.23 and climbed to almost $114 by 19 May before the 20 May drop brought it to $106.77 at close.[2] The $104.50 to $105.00 area absorbed the selloff and held as the weekly low. By the 21 May open, the Brent oil price had recovered to $106.58. The Brent-WTI spread held broadly stable through the week, both benchmarks moved in lockstep, driven by the same Hormuz variable.
Three things driving crude oil prices this week
The Iran deal signal and why the recovery matters more
Trump’s “final stages” comment moved oil prices immediately.[1] Three supertankers crossing Hormuz the same day added weight to the supply-return narrative, though analysts noted that three vessels does not constitute a sustained reopening.[2] The overnight partial recovery is the more important signal: WTI and Brent both held above their 20 May lows as of the 21 May open, suggesting the market is not fully pricing in a deal. Trump has made optimistic Iran statements before that did not hold.[5]
Inventory draws as the supply floor has not moved
US crude inventories fell for a fourth consecutive week per the EIA.[6] The IEA’s May 2026 report confirmed global observed inventories fell 250 million barrels across March and April, a 4 mb/d average draw, as strategic reserves offset disrupted Gulf flows.[3] The EIA’s Short-Term Energy Outlook separately projected Q2 2026 inventory draws averaging 8.5 mb/d when the full supply-demand gap is factored in.[4] Total Gulf production losses since February have reached 12.8 mb/d.[3] The physical market has not changed, crude oil prices today have moved on deal probability, not on any change to the supply picture.
A weaker dollar — the quiet tailwind
The DXY has been consolidating near 10-week lows, providing a quiet supportive backdrop for dollar-priced oil. FOMC minutes due around 21 May will give a clearer read on Fed rate direction. A dollar recovery would add pressure to both WTI and Brent from the currency side.
Levels to watch
The table below covers the reference zones across both crude oil benchmarks. These are reference levels, not trade signals.
| Instrument | Weekly low | Weekly high | Current level | Watch |
| WTI (USOUSD) | ~$100.50 | ~$108.94 | ~$102.18 | $100.5 floor |
| Brent (UKOUSD) | ~$104.50 | ~$114.00 | ~$106.59 | Iran news |
Table 1: Key crude oil price levels as of 01:50 (UTC) on 21 May 2026. Sources: TradingView, Trading Economics, CNBC. Indicative only.
For WTI (USOUSD), $100.50 held on a closing basis on 20 May and is the key near-term reference. The $108.94 area was the week’s high. For Brent oil (UKOUSD), $104.50 to $105.00 held the Wednesday low; $113.50 to $114.00 marked the high. Both oil benchmarks are reacting to Hormuz headlines within minutes, a position without a defined stop loss is taking on more event risk than usual.
What to watch this week and beyond
These are the events most likely to move crude oil prices in the near term:
- US-Iran deal talks, Ongoing: The number one variable. Any confirmed agreement would reprice both benchmarks significantly. Any breakdown brings the supply-floor story back into focus.
- EIA crude inventories, 21 May 2026: Inventories have fallen four weeks straight. A fifth draw reinforces the undersupply case and supports oil prices against the diplomatic noise.
- Strait of Hormuz vessel traffic, Ongoing: Three supertankers crossed on 20 May. Sustained increase in transits, or a further closure, is the clearest physical signal either way.
- FOMC minutes, ~21 May 2026: Dollar direction affects oil pricing. The minutes will show how divided the Fed is, which feeds into whether the DXY tailwind for oil holds.
Both benchmarks absorbed a sharp selloff and partially recovered. The charts going into 21 May show a market that moved fast on a diplomatic signal and is now watching to see whether it holds. A position in oil CFDs without a clear stop loss level is carrying overnight gap risk that is materially higher than normal. If you’re holding correlated positions across gold (XAUUSD) and short-dollar pairs alongside oil, check the combined exposure, in a fast risk-off or risk-on move, they can reprice in the same direction at once.
Leverage works both ways in a headline-driven market like this. Position sizing relative to account equity is worth revisiting before the EIA print on 21 May and any Hormuz development as both have the capacity to move WTI and Brent crude oil prices by several dollars in a short window.
RISK WARNING: CFDs are complex financial instruments and carry a high risk of losing money rapidly due to leverage. You should ensure you fully understand the risks involved and carefully consider whether you can afford to take the high risk of losing your money before trading.
Disclaimer: The information is provided for educational purposes only and does not take into account your personal objectives, financial circumstances, or needs. It does not constitute investment advice. We encourage you to seek independent advice if necessary. The information has not been prepared in accordance with legal requirements designed to promote the independence of investment research. No representation or warranty is given as to the accuracy or completeness of any information contained within. This material may contain historical or past performance figures and should not be relied on. Furthermore, estimates, forward-looking statements, and forecasts cannot be guaranteed. The information on this site and the products and services offered are not intended for distribution to any person in any country or jurisdiction where such distribution or use would be contrary to local law or regulation.
References
[1] “US crude oil falls below $100 per barrel after Trump says Iran talks in final stages — CNBC” https://www.cnbc.com/amp/2026/05/20/oil-price-today-iran-war-strait-hormuz-trump.html Accessed on 21 May 2026.
[2] “Brent crude oil futures fell more than 5% to the $105 per barrel mark — Trading Economics” https://tradingeconomics.com/commodity/brent-crude-oil Accessed on 21 May 2026.
[3] “Oil Market Report — May 2026, International Energy Agency” https://www.iea.org/reports/oil-market-report-may-2026 Accessed on 21 May 2026.
[4] “Short-Term Energy Outlook May 2026 — US Energy Information Administration” https://www.eia.gov/outlooks/steo/ Accessed on 21 May 2026.
[5] “Oil prices fall after Trump delays planned Iran strike — CNBC” https://www.cnbc.com/amp/2026/05/19/oil-today-brent-wti-iran-trump-hormuz-iea-supply-crude.html Accessed on 21 May 2026.
[6] “WTI crude futures fell for a 2nd straight session — Trading Economics” https://tradingeconomics.com/commodity/crude-oil Accessed on 21 May 2026.
[7] “Oil prices fall more than 7% as US and Iran appear close to deal — CNBC” https://www.cnbc.com/2026/05/06/oil-prices-trump-pauses-strait-of-hormuz-escort-effort.html Accessed on 21 May 2026.
[8] “World oil market severely undersupplied, to stay in deficit until Q4 — S&P Global” https://www.spglobal.com/energy/en/news-research/latest-news/crude-oil/051326-world-oil-market-severely-undersupplied-to-stay-in-deficit-until-q4-iea.html Accessed on 21 May 2026.
