The Analyst’s Read: Amazon at $231: Between the MAs and Caught Between Two Stories
Vantage Editorial Team >
Vantage Editorial Team >
Vantage is a global, multi-asset broker with a team of in-house writers and market analysts who produce educational and insightful trading content for traders of all levels.

Amazon stock (AMZN) is trading at $231.70 as of 15:31 (GMT+8) on 29 June 2026, up 1.26% on the session, but still nursing a decline of roughly 17% from its 5 May 2026 all-time high of $278.56.[1]
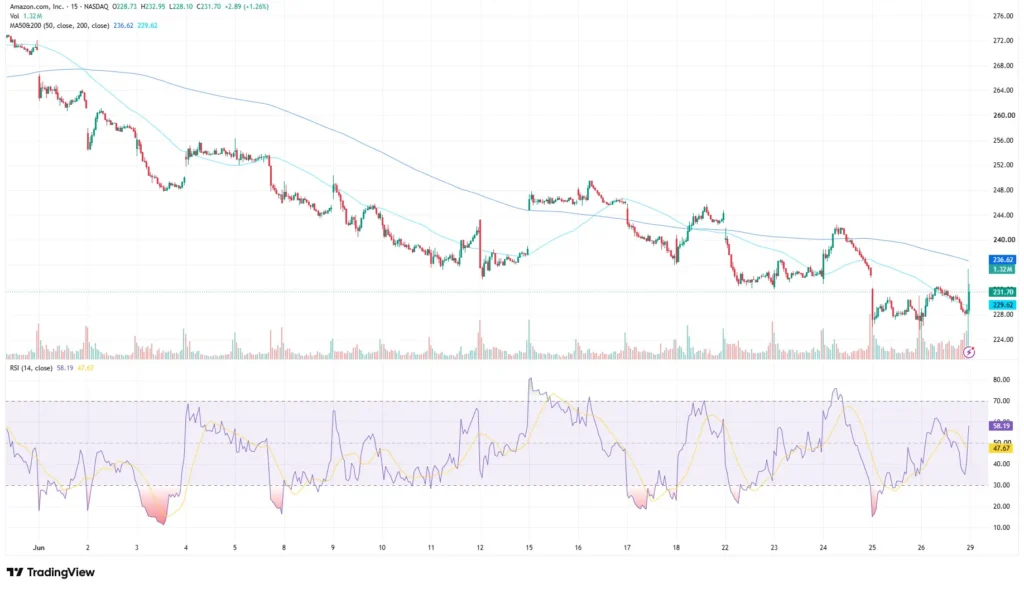
The 15-minute chart has price sitting between the MA50 at $236.62 above and the MA200 at $229.62 below, a narrow corridor for a stock whose fundamentals have rarely looked better. AWS just raised GPU reservation prices 20% effective 1 July 2026. Prime Day wrapped with an estimated $26.3 billion in online spending. Q1 2026 posted the fastest AWS growth in 15 quarters. The operating story is intact. The price action, so far, has not got the memo.[2][3]
All prices are from the Vantage AMZN CFD, as of 15:31 (GMT+8) on 29 June 2026. Chart data from the TradingView setup used for this analysis. This is not financial advice.
Key Points
- AMZN closed the session at $231.70, trading between its 15-minute MA50 at $236.62 (overhead resistance) and MA200 at $229.62 (below), with the RSI on the TradingView setup at 58.19, which is elevated but not overextended.
- AWS raised GPU reservation prices approximately 20% effective 1 July 2026 for Blackwell and Hopper chip families, a signal of sustained enterprise AI demand and pricing power, per Investing.com reporting.[3]
- Q1 2026 earnings posted EPS of $2.78 against a $1.64 consensus and AWS revenue growth of 28% year-on-year to $37.6 billion, the fastest in 15 quarters, while the stock has given back significant ground since the May high, making the technical and fundamental picture divergent.[4]
What the Chart Is Showing
AMZN opened June near $272 and spent the next three weeks doing what the broader tech sector was doing: giving back ground methodically. Lower highs, lower lows, through the $260s and $250s until the stock found a floor around $224 in the third week of June. No dramatic event triggered the slide. It was a slow, grinding correction off the May all-time high.
That $224 level held. The recovery into late June brought price back to $231.70, and what I see on the 15-minute chart now is a stock parked between two moving averages. The MA200 at $229.62 is the floor that has kept this recovery attempt alive. The MA50 at $236.62 is the ceiling that has not been reclaimed. Both values are taken directly from the chart header (MA50&200 (50, close, 200, close)), and they define the range until something breaks.
The RSI (14) on the TradingView setup used for this analysis reads 58.19, with the signal line at 47.67. That gap (RSI above signal by more than 10 points ) is the clearest near-term momentum read the chart is offering right now. It is not overbought; it is improving. What it is not is a green light. RSI in the mid-50s on a 15-minute chart tells you sellers have lost some urgency. That is a different thing from buyers being in control.
Where does this leave things? Price recovered off $224 and is now lodged in the gap between MA200 ($229.62) and MA50 ($236.62). That is the whole story on the 15-minute chart right now. Hold the MA200 on closes and the recovery attempt stays alive. Lose it, and the June correction has more to run. The chart has not resolved either way yet, which is exactly why the next few sessions matter.
The Fundamental Backdrop: AWS Pricing Power and the CapEx Question
Amazon’s Q1 2026 numbers were not ambiguous. EPS of $2.78 against a $1.64 consensus. Revenue of $181.5 billion against a $177.2 billion estimate. A record 13.1% operating margin. These are not metrics that suggest a company in trouble. The AWS GPU pricing action this week layers a fifth data point on top of the Q1 beat, and it is the one that arguably tells you the most about where demand is heading.
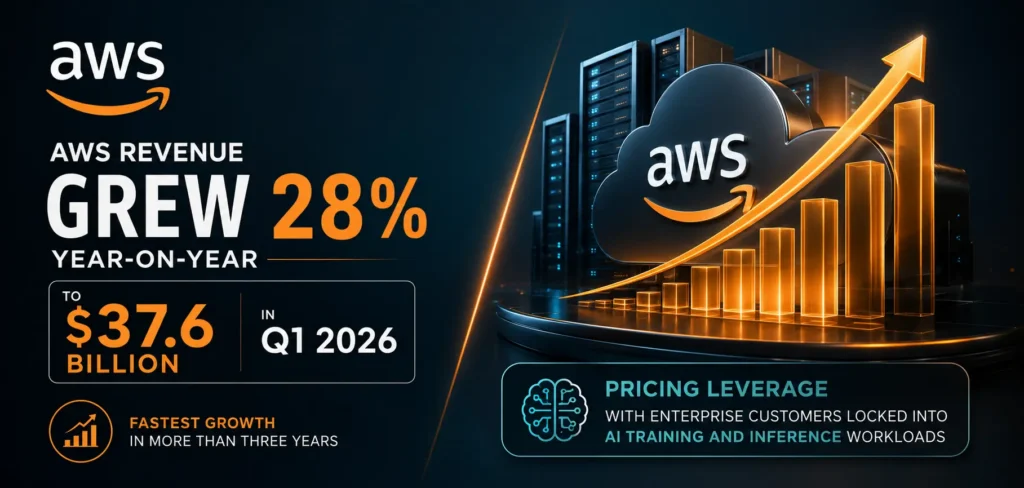
AWS revenue grew 28% year-on-year to $37.6 billion in Q1 2026, the fastest growth rate the segment has posted in 15 quarters, according to Amazon’s earnings release filed with the SEC.[4] Within that, Amazon’s AI-related revenue has reached a $15 billion annualised run rate approximately three years into the current AI cycle. CEO Andy Jassy noted on the earnings call that the chips business alone exceeded a $20 billion revenue run rate, growing triple digits year-on-year.[5]
Then came the pricing signal. AWS confirmed that GPU reservation prices for EC2 Capacity Blocks will rise approximately 20% effective 1 July 2026, applying to Nvidia’s Blackwell (B200, B300) and Hopper (H100, H200) chip families. Investing.com’s reporting on the pricing change noted that AWS revenue grew 28% year-on-year to $37.6 billion in Q1 2026, its fastest growth in more than three years, giving the unit pricing leverage with enterprise customers locked into AI training and inference workloads.[3]
The counterargument is capital expenditure. Amazon committed roughly $200 billion in CapEx for 2026 to AI infrastructure, and Q1 free cash flow declined sharply as a result. Prime Day 2026 (23 to 26 June 2026) added a near-term data point: Adobe Analytics estimated $26.3 billion in total online retail spending across the four-day event. Amazon was widely expected to account for a substantial share of that activity, though Adobe’s figures measure total online retail sales rather than Amazon’s own revenue directly.[6][7]
On the regulatory front, European authorities signalled in late June 2026 that AWS faces continued regulatory scrutiny in Europe, adding a longer-term headwind worth monitoring.
Where the Chart and the Fundamentals Diverge
Here is the part that is genuinely hard to explain away. AMZN is down 17% from its May all-time high. Q1 earnings beat on every single line. AWS just raised prices on its scarcest product. Prime Day is on track for a record. The stock is still 17% off its peak. That is an unusual set of facts to hold simultaneously. The market is clearly discounting something, and the most likely candidate is the $200 billion CapEx commitment and what it is doing to free cash flow. The alternative reading is simpler: the stock ran hard into May, and this is the correction that always follows.
My base case is that it is mostly the latter, with the CapEx narrative providing cover for what is essentially a post-ATH reset. Amazon’s $200 billion infrastructure commitment is large, but it is also the clearest public signal that enterprise AI demand has not plateaued. And then AWS raises GPU reservation prices 20% on the same week. You do not raise prices on a product that customers are walking away from.
The chart does not care about any of this. The MA50 at $236.62 is overhead. The MA200 at $229.62 is the floor. Right now, AMZN is in the middle, going nowhere fast. Reclaiming the MA50 on a sustained closing basis shifts the picture; $240 is the next level after that, and the chart shows multiple rejections there through mid-June. Until $236.62 is cleared, what we have is a well-run company trading below its moving averages while the market decides whether the CapEx story is a feature or a bug.
Follow the latest updates of Amazon stock outlook here.
Levels to Watch and Risk Framing
| Metric / Level | Support | Resistance | What I am watching |
| MA50 (15-min) | N/A | 236.62 | Price is below MA50; reclaim needed for near-term momentum shift |
| MA200 (15-min) | 229.62 | N/A | Price is above MA200; initial support remains intact as of 29 June |
| Near support | ~224 | N/A | Late-June corrective low; second test would test conviction of buyers |
| Near resistance | N/A | ~240 | Prior consolidation zone; multiple rejections in mid-June |
| RSI (TradingView) | N/A | N/A | 58.19 (14-period) on the TradingView setup; not overbought |
Table 1: Key levels for AMZN CFD as of 15:31 (GMT+8) on 29 June 2026. Source: TradingView chart data. Indicative only.
What to watch on the calendar:
- Q2 2026 Earnings, 30 July 2026: The next major catalyst. Q2 guidance called for net sales of $194 billion to $199 billion, well above the $188.9 billion consensus at the time of reporting.[4]
- AWS GPU pricing reset, 1 July 2026: The 20% price increase takes effect. Enterprise reaction, and whether Azure or Google Cloud follow with comparable hikes, will be watched closely.[3]
- EU Digital Markets Act review timeline: Any formal finding or timeline announcement from European authorities on AWS gatekeeper status could influence international revenue sentiment.
On Stop Loss and exposure: the zone between $229.62 (MA200) and $224 (recent corrective low) is where the structural question gets answered. Holding above the MA200 helps preserve the recovery attempt, but reclaiming the MA50 at $236.62 would provide stronger evidence that bullish momentum is returning. A close below $224 would shift the picture again. The 30 July 2026 earnings date is the next major catalyst, and what matters is that risk framing is explicit before that event, not reactive after it.
Leverage is a double-edged instrument. AMZN has historically exhibited a beta well above 1 versus the broader market, and the stock moved intraday by more than 4% in a single session during June 2026. In a range this compressed and with a major earnings date on 30 July 2026, position sizing relative to overall account equity is a practical consideration, not an afterthought. Leverage amplifies both outcomes equally.
RISK WARNING: CFDs are complex financial instruments and carry a high risk of losing money rapidly due to leverage. You should ensure you fully understand the risks involved and carefully consider whether you can afford to take the high risk of losing your money before trading.
Disclaimer: The information is provided for educational purposes only and doesn’t take into account your personal objectives, financial circumstances, or needs. It does not constitute investment advice. We encourage you to seek independent advice if necessary. The information has not been prepared in accordance with legal requirements designed to promote the independence of investment research. No representation or warranty is given as to the accuracy or completeness of any information contained within. This material may contain historical or past performance figures and should not be relied on. Furthermore estimates, forward-looking statements, and forecasts cannot be guaranteed. The information on this site and the products and services offered are not intended for distribution to any person in any country or jurisdiction where such distribution or use would be contrary to local law or regulation.
References
[1] “Amazon Stock Chart — NASDAQ:AMZN Stock Price — TradingView” https://www.tradingview.com/symbols/NASDAQ-AMZN/ Accessed on 29 June 2026.
[2] “Amazon (AMZN) Stock Rises as Prime Day Spending Hits $26.4 Billion, but Household Spend Falls — TipRanks via CNN” https://www.cnn.com/markets/stocks/AMZN Accessed on 29 June 2026.
[3] “AWS raising GPU instance prices 20% on July 1 — Investing.com” https://www.investing.com/news/stock-market-news/aws-raising-gpu-instance-prices-20-on-july-1-4762879 Accessed on 29 June 2026.
[4] “Amazon (AMZN) Q1 earnings report 2026 — CNBC” https://www.cnbc.com/2026/04/29/amazon-amzn-q1-earnings-report-2026.html Accessed on 29 June 2026.
[5] “Amazon Posts $181.5 Billion in Revenue and Smashes Wall Street’s Q1 Earnings Expectations — Variety” https://variety.com/2026/digital/news/amazon-earnings-q1-181-billion-1236733307/ Accessed on 29 June 2026.
[6] “Amazon Stock Has Stumbled in 2026. Prime Day Could Change the Story — Yahoo Finance / Barchart” https://finance.yahoo.com/markets/stocks/articles/amazon-stock-stumbled-2026-prime-204952230.html Accessed on 29 June 2026.
[7] “Should You Buy Amazon Stock Before June 26? — The Motley Fool” https://www.fool.com/investing/2026/06/24/should-you-buy-amazon-stock-before-june-26/ Accessed on 29 June 2026.
[8] “Amazon Stock Has Stumbled in 2026 — Barchart via Yahoo Finance” https://finance.yahoo.com/markets/stocks/articles/amazon-stock-stumbled-2026-prime-204952230.html Accessed on 29 June 2026.
