Technical analysis is filled with patterns that whisper clues about where the market may head next, yet few are as well-known as the head and shoulders chart pattern.
In Japanese candlestick analysis, the head and shoulders pattern is also known as the “Three Buddha”, a name that reflects its distinct three-peak structure.
Here’s a simple visual to help you picture the head and shoulders chart pattern:
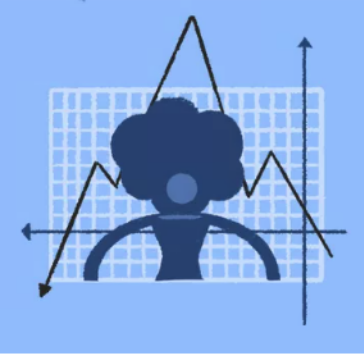
As you can see, it looks like a person standing upright, with the market tracing out a left shoulder, a head formed by the highest peak, and then a subsequent lower high that represents the right shoulder before slipping below the neckline.
Keep scrolling to learn more about the head and shoulders candlestick pattern.
What Is a Head and Shoulders Pattern?
The head and shoulders pattern typically represents a bullish-to-bearish reversal pattern in technical analysis. It appears after an uptrend and often signals that buyer momentum is slowing while sellers are preparing to take control.
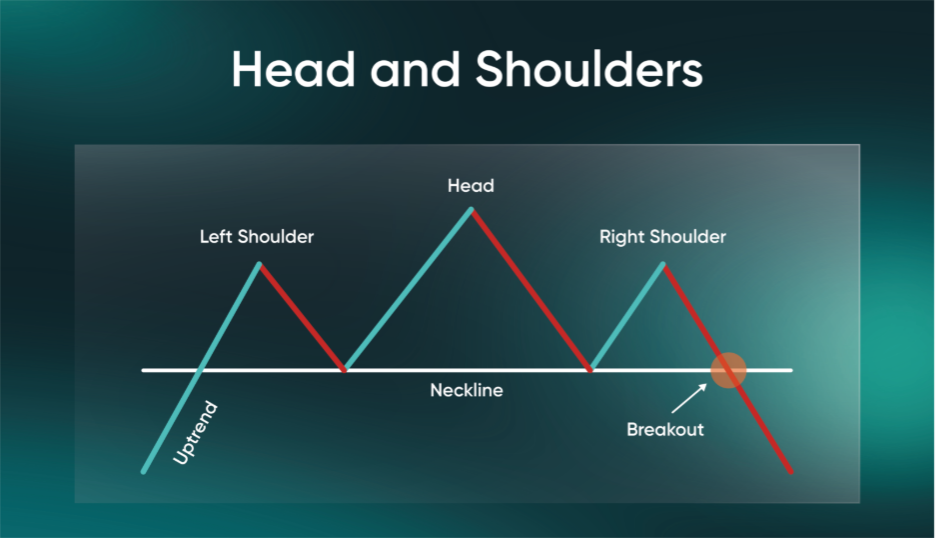
The pattern consists of three distinct peaks arranged above a baseline called the ‘neckline’:
- Left Shoulder: An initial peak with a preceding uptrend, followed by a pullback.
- Head: The highest peak positioned in the middle, marking the strongest push from buyers.
- Right Shoulder: A subsequent lower high that fails to match the head.
- Neckline: A support level that connects the reaction lows between the peaks.
If price falls below the neckline, it suggests a weakening bullish sentiment and may indicate downward pressure is increasing. The head and shoulders candlestick pattern can appear across markets—including stocks, forex, indices, and commodities—and is commonly used to help interpret potential changes in trend behaviour.
Common Variations of the Head and Shoulders Pattern in Real-World Trading
Markets rarely draw perfect shapes—and the head and shoulders chart pattern is no exception.
Common variations may include:
- Uneven shoulder heights
- A slightly upward- or downward-sloping neckline
- Minor differences in pullback depth or timing
These imperfections are often seen on trading charts in the real-world context. What matters most is understanding the concept of the heads and shoulders and how price action typically behaves around the neckline.
How Do You Confirm a Head and Shoulders Pattern?
A head and shoulders pattern is not considered complete until price breaks below the neckline. This move suggests the prior uptrend has weakened and that the market may be turning bearish.
Some helpful confirmation factors to consider are:
- A clear neckline break
- Increased selling volume during or after the break
- A retest of the neckline that holds as resistance
As with all trading chart patterns, confirmation signals like the head and shoulders should be analysed within the broader market context rather than used as standalone guidance.
What Does the Head and Shoulders Pattern Indicate?
The head and shoulders candlestick pattern reflects a gradual shift in market psychology.
During the early stages, buyers continue to push price upwards, but each subsequent rally shows reduced strength. Eventually, sellers begin to step in more aggressively, creating the lower high that forms the right shoulder.
From a trading psychology perspective, the head and shoulders pattern can be viewed as:
- Left Shoulder: Buying confidence remains, but early signs of hesitation appear.
- Head: Buyers make one final strong push.
- Right Shoulder: The inability to retest the head’s high suggests fading momentum.
When price eventually moves below the neckline, it reinforces the idea that buyer enthusiasm has diminished and that sellers may be gaining control.
For example, Tesla‘s stock has formed the classic head and shoulders pattern in past market cycles, showing similar shifts in sentiment where initial optimism gradually gave way to consolidation and declining momentum1.
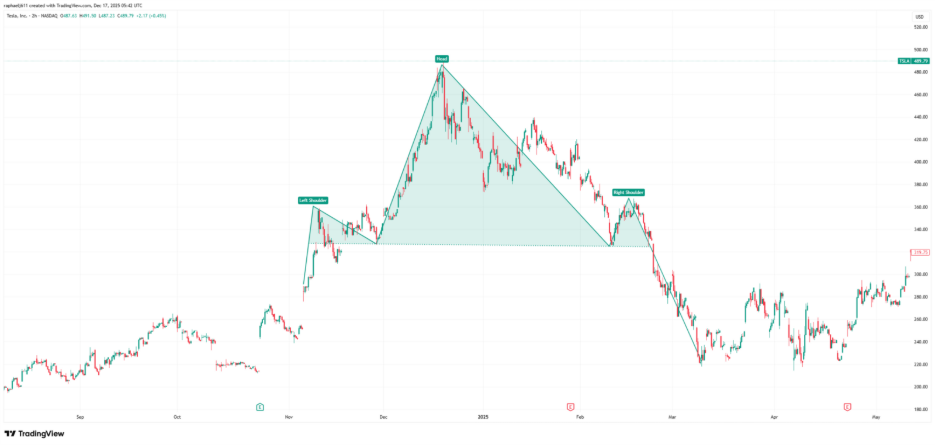
Example of a head and shoulders pattern forming on Tesla (November 2024–March 2025): https://www.tradingview.com/x/eqwpERQ7/
What Is an Inverse Head and Shoulders Pattern?
[insert a stock image of the inverse head and shoulders pattern]
While the traditional head and shoulders pattern is known for signalling potential bullish-to-bearish reversals, its opposite—the inverse head and shoulders pattern—typically represents a bearish-to-bullish shift in market sentiment.
Both patterns share the same structural logic but mirror each other in orientation and implication inversely.
What it looks like:
The inverse head and shoulder pattern forms when:
- Price makes a low (left shoulder)
- Followed by a lower low (head)
- Then a higher low (right shoulder)
- All while oscillating beneath a horizontal or slightly sloping neckline
Once price breaks above the neckline, market participants often interpret it as a sign that sellers are losing control and buyers are beginning to regain strength.
Is the Head and Shoulders Pattern Reliable?
The head and shoulders pattern is widely recognised in technical analysis. However, its reliability depends on context, structure, and confirmation. The table below summarises key advantages and disadvantages before exploring them in more detail.
| Advantages | Disadvantages |
| Clear and recognisable structure | Imperfect shapes may confuse beginners |
| Used for discretionary and rule-based analysis | False breakouts can occur—requires confirmation and should not be used as a standalone signal |
| Appears across multiple markets and timeframes | Stop-loss distances may be wide |
3 Advantages of the Head and Shoulders Explained
While no trading chart pattern guarantees outcomes, the head and shoulders formation can offer some practical advantages that support structured analysis in an educational context.
1. Clear Structure
The three-peak formation of the head and shoulders pattern is relatively distinct, which may make it easier to identify even when real-world charts show slight asymmetry or a tilted neckline.
2. Logical Risk and Reference Levels
Hypothetical entry points using the head and shoulders pattern. This illustration is for educational purposes only, and traders should fully understand the chart pattern and its risks before applying it in live markets.
The neckline break provides a commonly watched reference point, while the right-shoulder high (or low, for inverse patterns) often serves as a logical area for defining risk. These reference zones can support a more structured approach when analysing the charts.
3. Potential for Meaningful Trend Shifts
As head and shoulders patterns often form over extended periods, the market moves that follow a confirmed reversal can unfold across significant price distances. Outcomes vary, but the pattern is often used to highlight potential changes in momentum.
3 Disadvantages of the Head and Shoulders to Look Out For
While the head and shoulders pattern is widely recognised, it also comes with limitations that should be understood before applying it. Real-world conditions rarely produce perfect structures, and breakouts can behave differently depending on volatility, liquidity, and broader market sentiment.
1. Real-Market Imperfections
Real markets rarely move with textbook neatness.
Necklines may slope, shoulders may be uneven, and volume behaviour may not follow the ideal script. These variations can make the pattern difficult to interpret for beginners who expect a perfect diagram.
2. Potentially Wide Stop-Loss Placement
The vertical distance between the head and the neckline may create wider stops than some would prefer, especially in volatile markets.
3. Retests Can Create Uncertainty
A neckline break followed by a sharp retest can make it difficult to determine whether the move is genuine or a temporary spike. Think of it as a door that swings open, then briefly nudges back before truly closing. This uncertainty may lead to premature entries or exits.
What Are the Common Head and Shoulders Mistakes to Avoid?
Based on technical literature, there are four common head and shoulders mistakes to avoid:
- Entering before the neckline breaks (premature confirmation)
- Ignoring volume behaviour
- Forcing the pattern onto unrelated price action
- Treating the pattern as a guarantee instead of one tool among many
What if the Head and Shoulders Pattern Fails?
A pattern is considered ‘failed’ when price breaks below the neckline (suggesting a bearish continuation) but then quickly reverses and pushes back above it.
This behaviour indicates that sellers could not maintain control and that buyers may be stepping back in with stronger momentum. A failed head and shoulders can sometimes imply a shift in sentiment away from the expected bearish scenario. When failures occur:
- Some traders wait for a confirmed close back above the neckline
- A successful retest of the neckline from above can support the idea of strengthening bullish interest
- Tighter stops or reduced position sizing are often used due to the potential for volatility
As always, trading decisions should incorporate broader market context and supporting tools.
7 Head and Shoulders Pattern Trading Strategies to Explore
The head and shoulders pattern is often analysed for structured entry, risk, and confirmation techniques. The trading strategies listed below discuss common approaches that are presented for educational purposes only.
3 Popular Head and Shoulders Entry Strategies to Consider
Let’s begin by looking at three commonly used head and shoulders entry strategies.
1. Breakout Entry
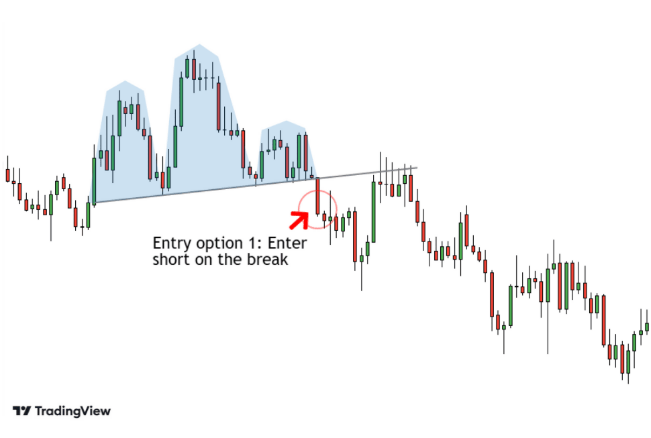
A frequently discussed approach is to wait for a decisive close below the neckline. This suggests that bearish pressure has strengthened.
Risk Note: Confirmation is key; false breaks can occur.
2. Retest Entry
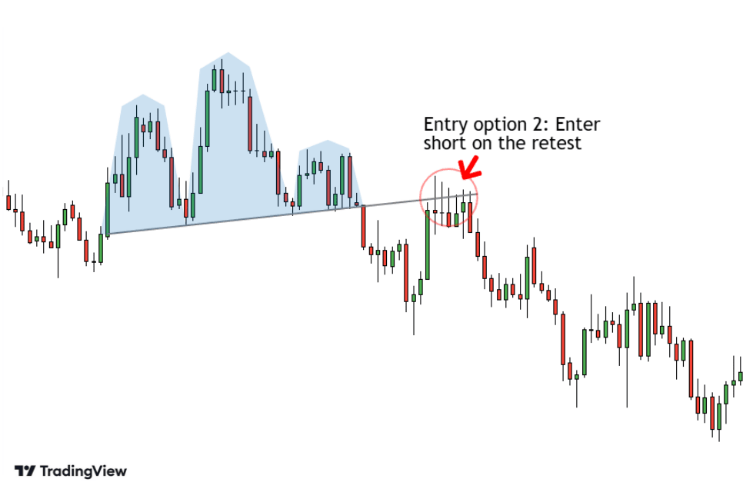
A more conservative entry to consider would ideally be when price breaks the neckline and then retest it from below. If the neckline holds as resistance, the retest is interpreted as additional confirmation.
3. Early Shoulder Entry (Not a Confirmed Setup)
Some market participants watch the right-shoulder area for potential clues about how the pattern is forming. However, acting before a neckline break introduces significantly more uncertainty because the pattern has not yet confirmed.
For educational purposes, it’s generally safer to view early-formation movements as context rather than as a trade signal on their own.
4. Stop-Loss Placement
Stop-loss placement helps define where the head and shoulders pattern would be considered invalid. Some common approaches include:
- Above the Right Shoulder: A break above this point likely invalidates the bearish structure.
- Above the Head (More Conservative): Provides a wider cushion for volatile markets, but it requires accepting greater risk.
Instead of relying solely on the candlestick pattern’s geometry, stop-loss decisions should always consider market volatility, trading timeframe, and individual risk tolerance.
Related Article: Basics of Risk Management
5. Calculate the Profit Target
When estimating the potential profit target of the head and shoulders, many market participants use the measured-move approach:
- Measure the vertical distance between the head and the neckline.
- Subtract that distance from the neckline break to estimate a possible target zone.
Example Scenario
- Head: USD150
- Neckline: USD140
- Vertical Distance: USD10
- Estimated Projection: USD140 − USD10 = USD130
Take note that targets should be treated as guidelines rather than guarantees, as price behaviour varies across trading instruments and market conditions.
6. Apply Risk Management Techniques
Risk management addresses how much exposure a trader accepts, independently from where stops or targets are placed. Here are some key factors to consider:
- Position Sizing: Adjust trade size to fit personal risk tolerance.
- Use of Stop-Loss Orders: Helps to cap potential losses if the market moves against expectations.
- Avoid Over-Leveraging: Excessive leverage increases the impact of adverse price swings.
- Cross-Check With Broader Analysis: Review other chart patterns, trend context, and external market conditions to avoid relying on the head and shoulders pattern alone.
A useful rule for beginners: Do not risk more than you are comfortable losing in a single trade.
7. Use With Other Technical Indicators
Like any other chart formation, the head and shoulders pattern should not be used in isolation. Supplementary technical indicators can help provide additional context on trend strength, momentum, and participation around the neckline.
- Relative Strength Index (RSI): This indicator can help highlight changes in trading momentum. For instance, weakening RSI near the head or during a neckline test may reflect slowing bullish strength. Divergence should be viewed as contextual information rather than confirmation on its own.
- Moving Average Convergence Divergence (MACD): Momentum shifts or changes in histogram slope may support the idea of a potential trend transition. MACD signals should complement—not replace—analysis of the pattern’s structure.
- Moving Averages (MAs): Short- or medium-term moving averages can help illustrate broader trend direction. A downward turn in key averages might align with a developing reversal, whereas sustained upward slopes may suggest the underlying trend remains intact.
- Volume Indicators: Monitoring volume around the neckline can offer additional insights into market participation. Increasing volume may indicate stronger engagement at key levels, while muted volume can signal hesitation.
Platforms such as TradingView allow traders to mark neckline breaks and track volume easily, giving clarity during fast-moving markets.
These technical indicators are best viewed as supporting context, helping traders assess whether broader market conditions align with the structure of the head and shoulders pattern. They should form part of a more comprehensive analytical approach rather than acting as standalone guidance.
Bringing the Head and Shoulders Pattern Into Context
The head and shoulders pattern remains one of the most recognisable structures in technical analysis, offering insight into when market momentum may be shifting from buyers to sellers. Rather than providing signals on its own, the candlestick pattern acts as a visual framework to help interpret changes in sentiment across markets including stocks, forex, commodities, and indices.
Like all chart patterns, its effectiveness depends on broader context such as trend conditions, volatility, liquidity, and supporting analysis. It should be used alongside technical tools and sound risk management principles.
Practising on a Vantage Demo Account can help improve familiarity with identifying the head and shoulders pattern and exploring how the neckline breaks, retests, and volume behaves. Trading platforms such as Vantage’s MetaTrader 4 and 5 offer charting tools that make this analysis more accessible.
Once you’re more confident in analysing the head and shoulders pattern, you may choose to transition to opening a Vantage Live Account and explore the markets in real time.
Frequently Asked Questions (FAQ)
Is the head and shoulders pattern a bullish pattern?
No, the traditional head and shoulders pattern is generally viewed as a bearish reversal pattern, signalling a potential shift from buying strength to increasing selling pressure. Its opposite—the inverse head and shoulders pattern—is the bullish version, often associated with a potential upward reversal.
What does a head and shoulders pattern suggest?
The head and shoulders pattern suggests that the prevailing uptrend may be weakening. As the structure forms, buyers struggle to push price to new highs, while sellers begin stepping in more aggressively.
A confirmed break below the neckline is what typically signals that bearish momentum may be taking over.
What will happen after a head and shoulders pattern forms?
If the head and shoulders pattern completes and breaks the neckline, price may continue lower towards a projected zone based on the pattern’s height.
However, market outcomes vary, and this projection should be treated only as a guideline—not a guarantee. As such, effective risk management remains essential.
What timeframe is best for identifying a head and shoulders pattern?
The head and shoulders pattern can appear on any timeframe, but it’s often clearer on higher intervals such as the daily, weekly, or monthly charts. These longer timeframes typically help to reduce short-term noise, which can make the head, shoulders, and neckline easier to identify.
Once I spot a head and shoulders pattern, should I short or go long?
To determine whether a head and shoulders pattern should be shorted or go long, it’s important to wait for confirmation. Many traders typically wait for a confirmed close below the neckline before considering bearish setups rather than acting during the formation of the right shoulder.
Keep in mind that the head and shoulders pattern should not be used in isolation—context, volume behaviour, and other technical factors can help determine whether the signal aligns with broader market conditions.
Why do false breakouts happen with the head and shoulders pattern?
False breakouts may occur when the market temporarily dips below the neckline to test liquidity, trigger stop-loss orders, or react to short-lived volatility.
This is why some traders choose to wait for a sustained close below the neckline or look for supporting evidence such as increased volume before interpreting the move as a confirmed breakout.
Can beginners rely on the head and shoulders pattern solely?
It’s not advisable for beginners to rely on the head and shoulders pattern solely. Although this candlestick pattern is relatively well-known, it should be treated as one component of a broader technical analysis framework.
Combining the head and shoulders pattern with other tools such as volume analysis, RSI, MACD, or trend assessment provides a more balanced view of market conditions.
RISK WARNING: CFDs are complex financial instruments and carry a high risk of losing money rapidly due to leverage. You should ensure you fully understand the risks involved and carefully consider whether you can afford to take the high risk of losing your money before trading.
Disclaimer: The information is provided for educational purposes only and doesn’t take into account your personal objectives, financial circumstances, or needs. It does not constitute investment advice. We encourage you to seek independent advice if necessary. The information has not been prepared in accordance with legal requirements designed to promote the independence of investment research. No representation or warranty is given as to the accuracy or completeness of any information contained within. This material may contain historical or past performance figures and should not be relied on. Furthermore estimates, forward-looking statements, and forecasts cannot be guaranteed. The information on this site and the products and services offered are not intended for distribution to any person in any country or jurisdiction where such distribution or use would be contrary to local law or regulation.