



 Updated
Chart patterns are recurring shapes that form on a price chart — such as Head and Shoulders, Double Tops, and Triangles — created when buyers and sellers repeatedly push price toward the same levels of support and resistance. Reading these formations is one of the more practical entry points into technical analysis, because the shapes reflect shifts in market psychology rather than abstract theory.
Some chart patterns signal that a trend is likely to continue, others suggest a reversal is forming, and a smaller group simply flags rising uncertainty. Even basic chart patterns like the Double Top or Ascending Triangle appear across forex, stocks, indices, and commodities, because the underlying behaviour — buyers and sellers competing at the same price levels — tends to repeat regardless of the asset. The 10 patterns below cover the formations traders encounter most often, including how each one tends to form and where it can fail.
This article is provided for general educational purposes only and should not be regarded as investment advice, a recommendation, or a solicitation to trade any financial instrument.
Key Points
- Chart patterns are visual formations that reflect shifts in market psychology between buyers and sellers, falling broadly into continuation, reversal, and bilateral categories.
- The 10 patterns covered here — including Head and Shoulders, Double Top, and the triangle formations — recur across forex, stocks, indices, and commodities because they reflect repeatable trading behaviour rather than asset-specific quirks.
- Using chart patterns effectively depends on waiting for confirmation, combining them with other technical indicators, and applying consistent risk management, since no pattern guarantees a specific outcome.
What are Chart Patterns in Trading?
Chart patterns are recognisable shapes that emerge when price movements are plotted on a chart — whether a candlestick chart, line, or bar chart. They act as visual footprints of market psychology, showing how buyers and sellers interact at critical levels of support and resistance.

By studying these formations, traders may use them to help interpret whether the market could continue in its current direction or shift course altogether. Patterns that emerge during a sustained decline — sometimes referred to broadly as downtrend chart patterns — include the Descending Triangle and the bearish versions of the Head and Shoulders and Double Top, both covered below.
Chart patterns fall into three broad categories:
- Continuation patterns. These are interpreted as pauses in an existing trend, which some traders view as potential signs the trend may continue. Examples include rectangles, triangles, flags, cup-and-handle, and pennants — usually a consolidation phase where some traders take profits while others enter before the trend resumes.
- Reversal patterns. These are interpreted by traders as potential signs that a prevailing trend could be weakening and may reverse — a bullish trend turning bearish, or vice versa. Head and Shoulders, Double Tops, and Double Bottoms are common examples, often forming after a prolonged move in one direction.
- Bilateral patterns. These suggest the market could break in either direction, reflecting genuine uncertainty rather than a clear lean toward continuation or reversal. The Symmetrical Triangle, covered later in this guide, is the clearest example.
Chart patterns are popular partly because they are versatile. The same formations turn up across forex, equities, indices, and commodities — markets that traders can speculate on through CFDs — because the principles behind them are rooted in human behaviour, which tends to repeat.
A trader studying a candlestick chart might notice a double bottom forming in a stock index or a flag developing on a gold CFD chart. As with any branch of technical analysis, timeframe matters: patterns that appear on daily or weekly charts usually carry more weight than those on intraday charts, even though a five-minute pattern can still be useful for day traders working shorter setups.
Continuation, Reversal, and Bilateral Patterns at a Glance
Before working through each formation in depth, it helps to see how the 10 patterns relate to one another. Several are mirror opposites — an Ascending Triangle and a Descending Triangle, or a Head and Shoulders and its inverse — while the Symmetrical Triangle can resolve in either direction depending on how price eventually breaks out. The table below groups all 10 by category and typical bias, alongside the difficulty rating used throughout this guide.
| Pattern | Category | Typical Bias | Difficulty |
| Head and Shoulders | Reversal | Bearish | Intermediate |
| Inverse Head and Shoulders | Reversal | Bullish | Intermediate |
| Double Top | Reversal | Bearish | Beginner–Intermediate |
| Double Bottom | Reversal | Bullish | Beginner–Intermediate |
| Ascending Triangle | Continuation | Bullish | Beginner–Intermediate |
| Descending Triangle | Continuation | Bearish | Beginner–Intermediate |
| Symmetrical Triangle | Bilateral | Neutral | Intermediate |
| Flag | Continuation | Follows prior trend | Beginner |
| Pennant | Continuation | Follows prior trend | Beginner–Intermediate |
| Cup and Handle | Continuation | Bullish | Intermediate |
10 Essential Chart Patterns for Traders
Chart patterns are a cornerstone of technical analysis, helping traders interpret market sentiment and anticipate potential price moves. These formations appear repeatedly across different markets and timeframes, making them useful for identifying reversals, continuations, or periods of consolidation.
Below are 10 essential chart patterns that every trader should be familiar with.
1. Head and Shoulders — Bearish Reversal
The Head and Shoulders pattern is one of the most widely studied reversal patterns in trading. It usually forms at the top of an uptrend and signals that buying momentum is fading.
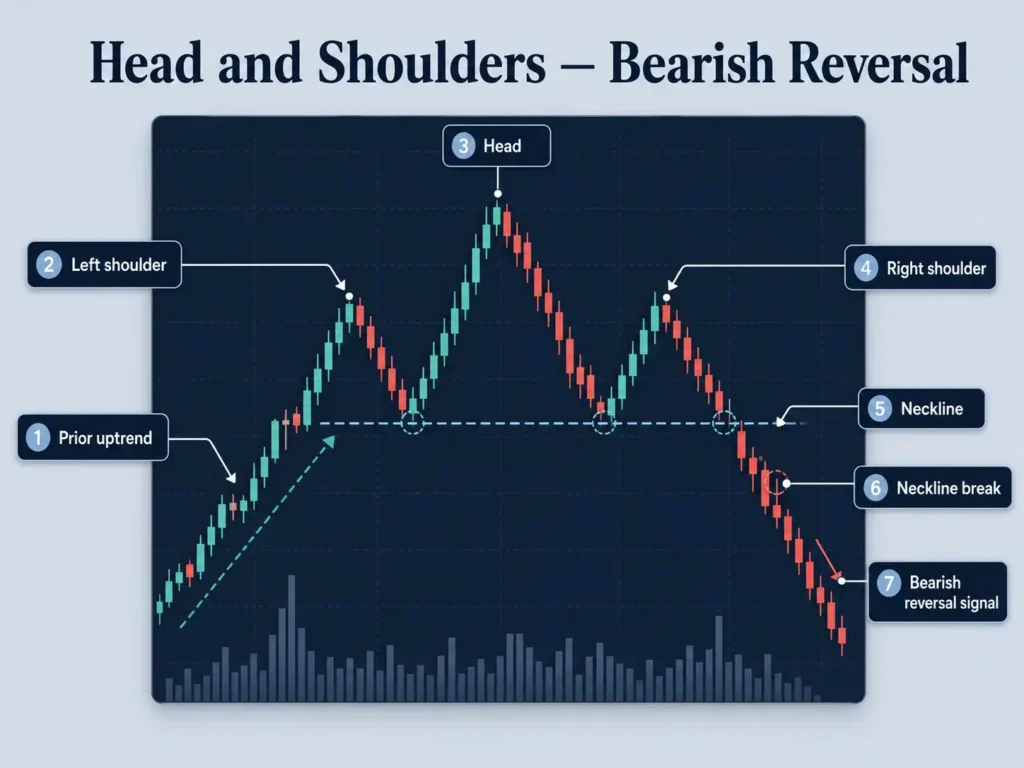
The pattern has three peaks: the left shoulder, the higher middle peak known as the head, and the right shoulder, which is typically similar in height to the left. The critical feature is the neckline, which connects the lows beneath the shoulders.
When price breaks below this neckline, traders may interpret it as a potential bearish reversal signal and monitor whether downside momentum develops. Traders often monitor this setup as a possible sign of a trend change after a long rally.
Key features:
- Three-peak structure, with the middle peak (the head) higher than both shoulders
- Neckline break below the shoulder lows is the standard confirmation signal
- Most reliable on daily or weekly charts, where the formation reflects weeks of trading activity
- Commonly seen at the end of an extended uptrend, across forex, indices, and individual stocks
2. Inverse Head and Shoulders — Bullish Reversal
The Inverse Head and Shoulders pattern is the mirror image of the classic Head and Shoulders pattern and signals a potential bullish reversal.
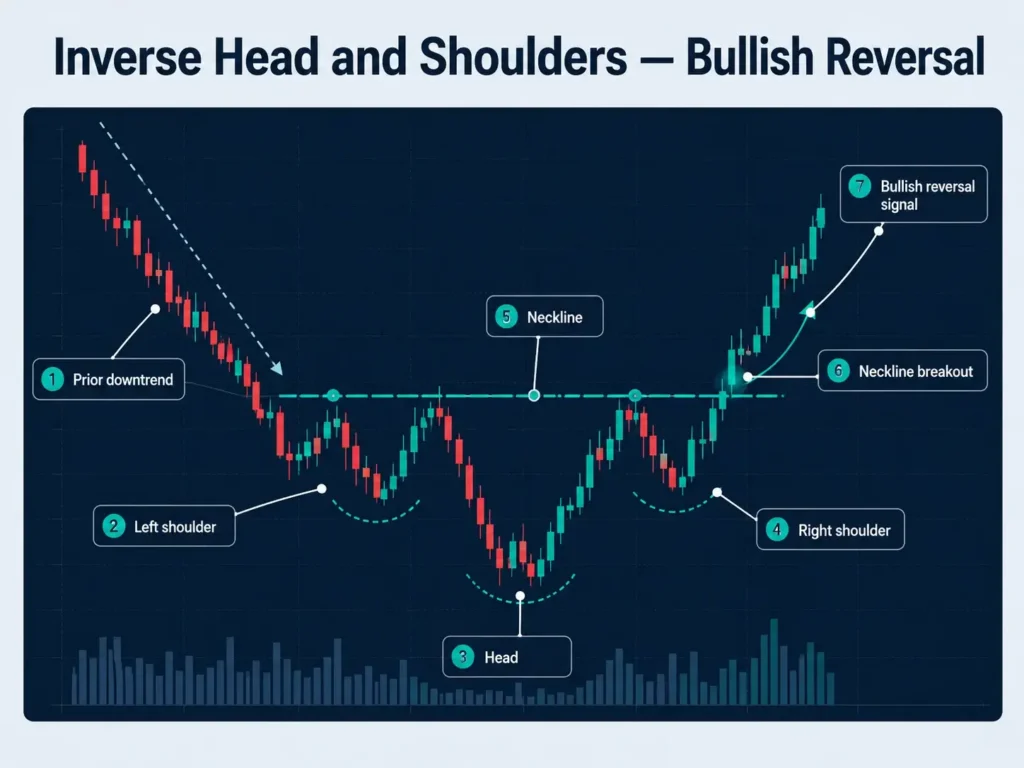
Instead of peaks, three troughs form: the middle trough (the head) is the lowest point, while the two side troughs (the shoulders) sit higher. The neckline connects the highs between the troughs.
A breakout above the neckline is often interpreted by traders as a potential shift from selling pressure to buying momentum, with some monitoring whether buying momentum strengthens once the breakout is confirmed by a rise in volume. This pattern often appears after a downtrend and is sometimes viewed as an indication of a potential bullish phase.
Key features:
- Three-trough structure, with the head forming the lowest point between two higher shoulders
- Neckline break above the shoulder highs is the standard confirmation signal
- Typically appears at the end of a prolonged downtrend
- Mirrors the Head and Shoulders pattern in structure but signals the opposite direction
3. Double Top — Bearish Reversal
The Double Top pattern shows up when price attempts to break through a resistance level twice but fails both times. This creates two peaks at roughly the same level, separated by a moderate pullback.
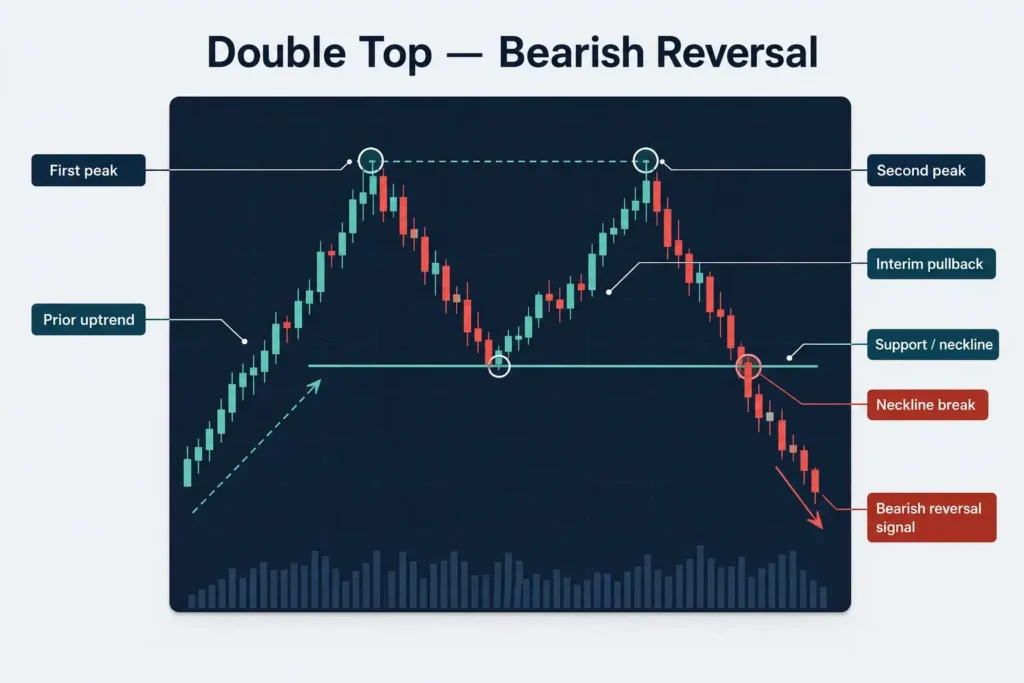
The inability to push higher signals that the uptrend is losing steam. Confirmation comes when price breaks below the support — or neckline — formed by the interim pullback.
Traders often interpret a Double Top as a possible sign of trend exhaustion and potential bearish momentum, particularly on daily charts, where the pattern tends to carry more weight.
Key features:
- Two peaks at a similar price level, separated by a pullback to an interim support level
- Confirmed once price closes below the support formed between the two peaks
- More reliable on daily or higher timeframes than on intraday charts
- Often forms after an extended uptrend as buying pressure fades
4. Double Bottom — Bullish Reversal
The Double Bottom is the bullish counterpart to the Double Top. It forms after a downtrend when price tests a support level twice and bounces higher both times.
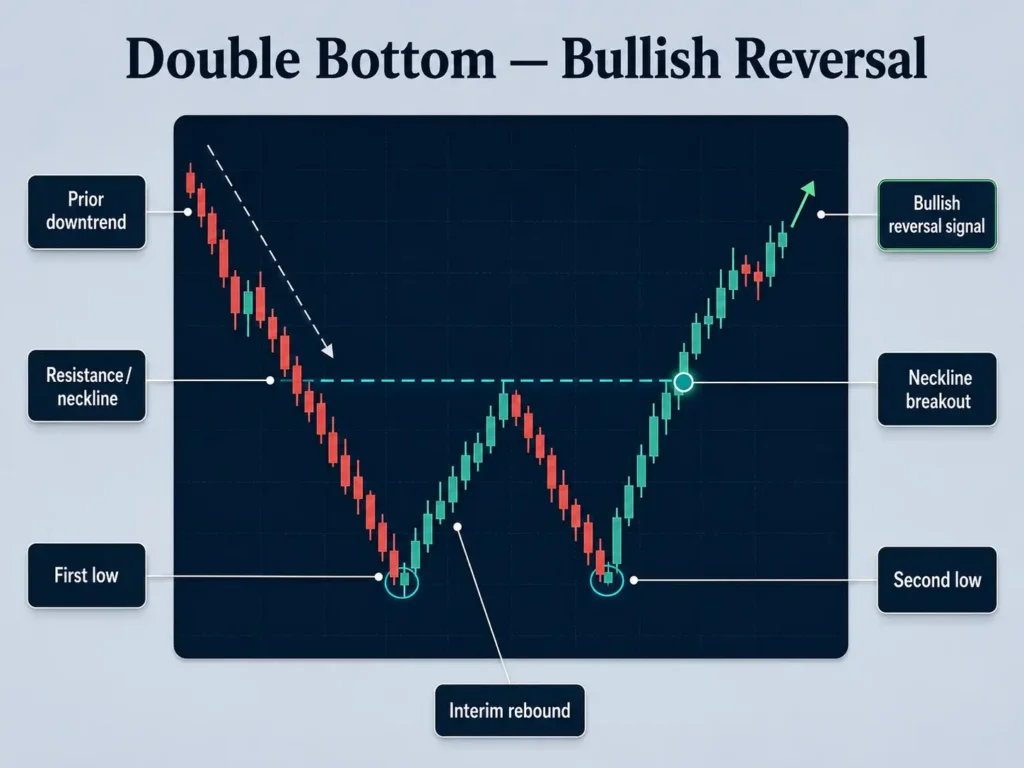
The two lows create a ‘W’ shape on the chart. This repeated rejection of lower prices suggests the balance is tilting in favour of buyers. When price breaks above the neckline, some traders view it as a potential bullish reversal.
Traders often use this pattern as a reference point when analysing markets after prolonged declines, including in major indices and commodity CFDs such as gold.
Key features:
- Two lows at a similar price level, forming a ‘W’ shape on the chart
- Confirmed once price closes above the resistance formed between the two lows
- Signals that selling pressure may be fading after a sustained downtrend
- Frequently referenced alongside the Double Top as a mirror-image pairing
5. Ascending Triangle — Bullish Continuation
An Ascending Triangle is a continuation pattern that reflects growing buying pressure. It is marked by a horizontal resistance line at the top and a rising trendline at the bottom.
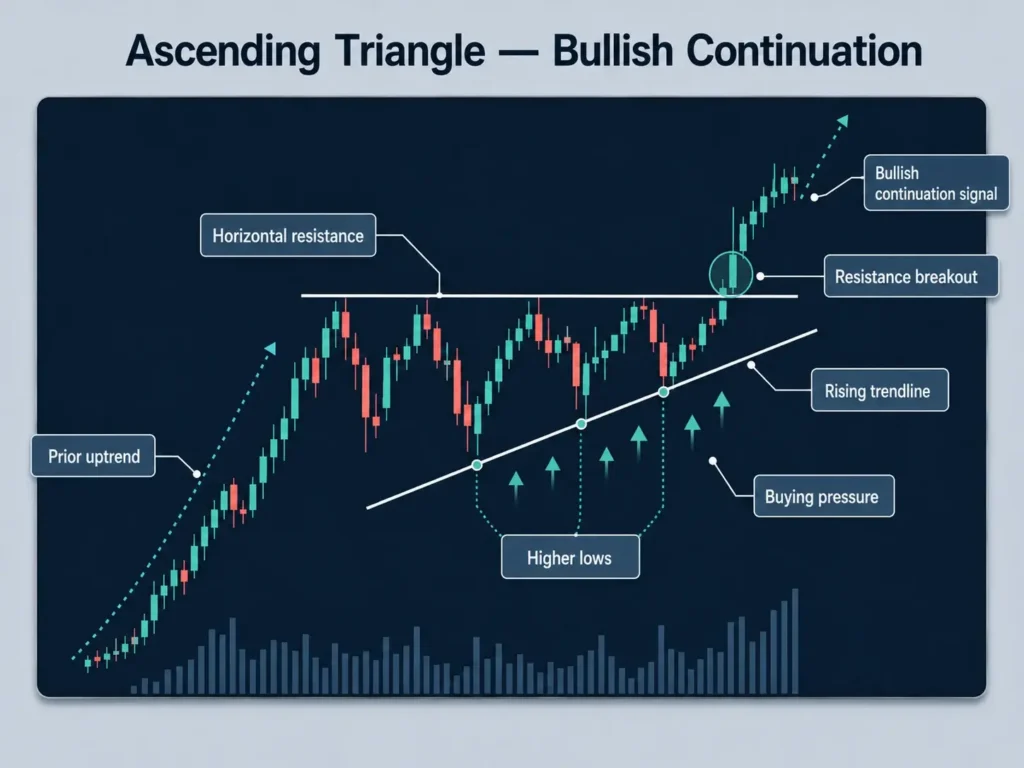
Price keeps bouncing between the two lines, forming higher lows each time. This shows buyers becoming more aggressive while sellers struggle to push the price lower. A breakout above the resistance line is often seen by traders as a potential continuation signal.
Traders sometimes use this setup when analysing potential uptrend conditions, and the pattern appears commonly in volatile instruments such as cryptocurrency or commodity CFDs.
Key features:
- Horizontal resistance line paired with a rising trendline of higher lows
- Breakout above resistance is the standard continuation signal
- Reflects increasingly aggressive buying pressure as the pattern develops
- Frequently seen in volatile instruments, including commodity CFDs
6. Descending Triangle — Bearish Continuation
The Descending Triangle is the mirror counterpart to the Ascending Triangle, and one of the more commonly referenced downtrend chart patterns. The support level stays flat at the bottom, while the resistance line slopes downward.
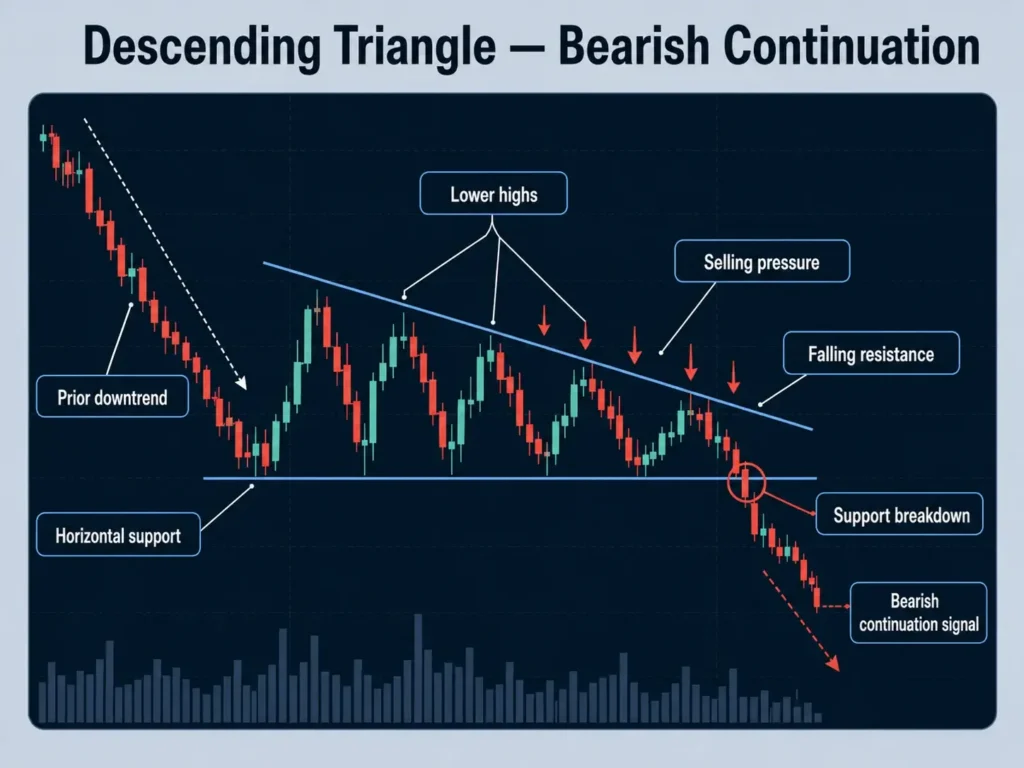
Price continues to form lower highs, showing that sellers are steadily pushing the market down. Eventually the pressure builds until support gives way, leading to a breakdown.
This is commonly interpreted as a bearish continuation signal, though outcomes are never guaranteed, and the pattern is often seen during market corrections or bearish phases in stocks and indices.
Key features:
- Flat horizontal support paired with a downward-sloping resistance line
- Breakdown below support is the standard continuation signal
- Reflects persistent selling pressure as lower highs continue to form
- Often grouped with other downtrend chart patterns during broad market corrections
7. Symmetrical Triangle — Bilateral Consolidation
The Symmetrical Triangle is a bilateral chart pattern that forms when buyers and sellers are roughly equally matched.
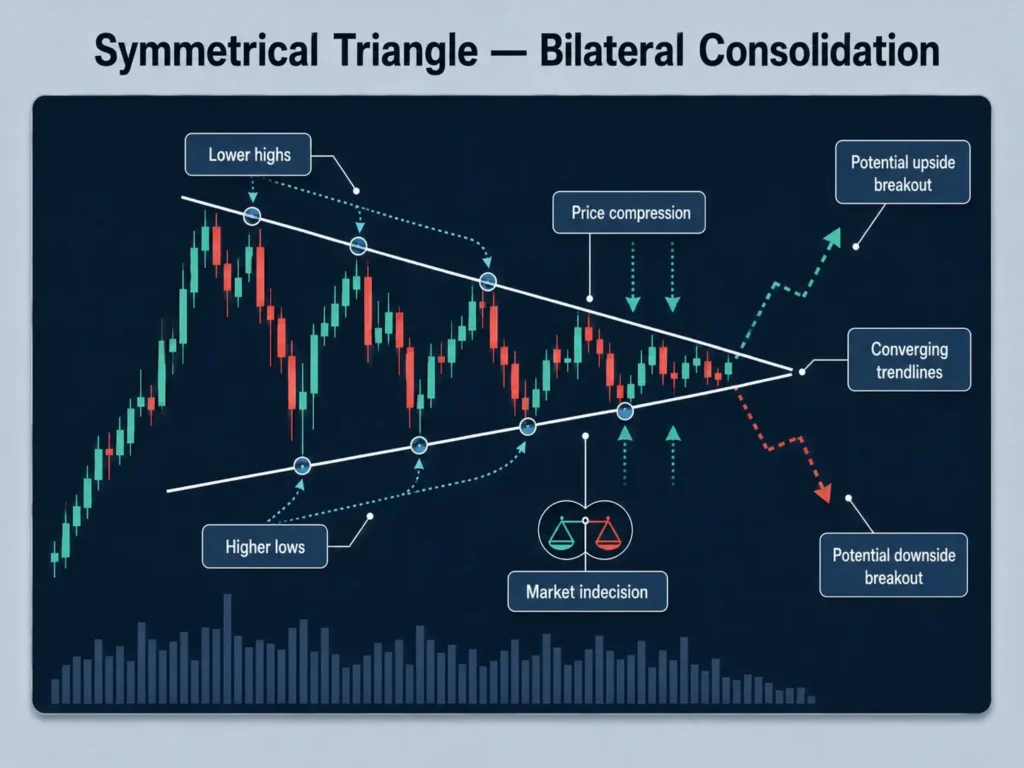
Price squeezes into a narrowing range, with lower highs and higher lows creating two converging trendlines. This signals indecision in the market, often occurring during consolidation phases.
While the direction of the eventual breakout is uncertain, the move that follows is usually sharp because of the built-up pressure. Traders often wait for a confirmed breakout above resistance or below support, and frequently use a secondary indicator — such as the Money Flow Index or Relative Volume — to help confirm direction once it emerges.
Key features:
- Two converging trendlines formed by lower highs and higher lows
- Breakout direction is not predetermined, unlike continuation or reversal patterns
- Often paired with a secondary indicator to help confirm the breakout direction
- Builds price pressure that can produce a sharper move once it resolves
8. Flag Patterns — Short-Term Continuation
Flag patterns occur after a strong price move, marked by the ‘flagpole.’ Following this sharp rally or selloff, the market consolidates in a small rectangular shape that slopes slightly against the trend, allowing traders to catch their breath before the price continues in the same direction.
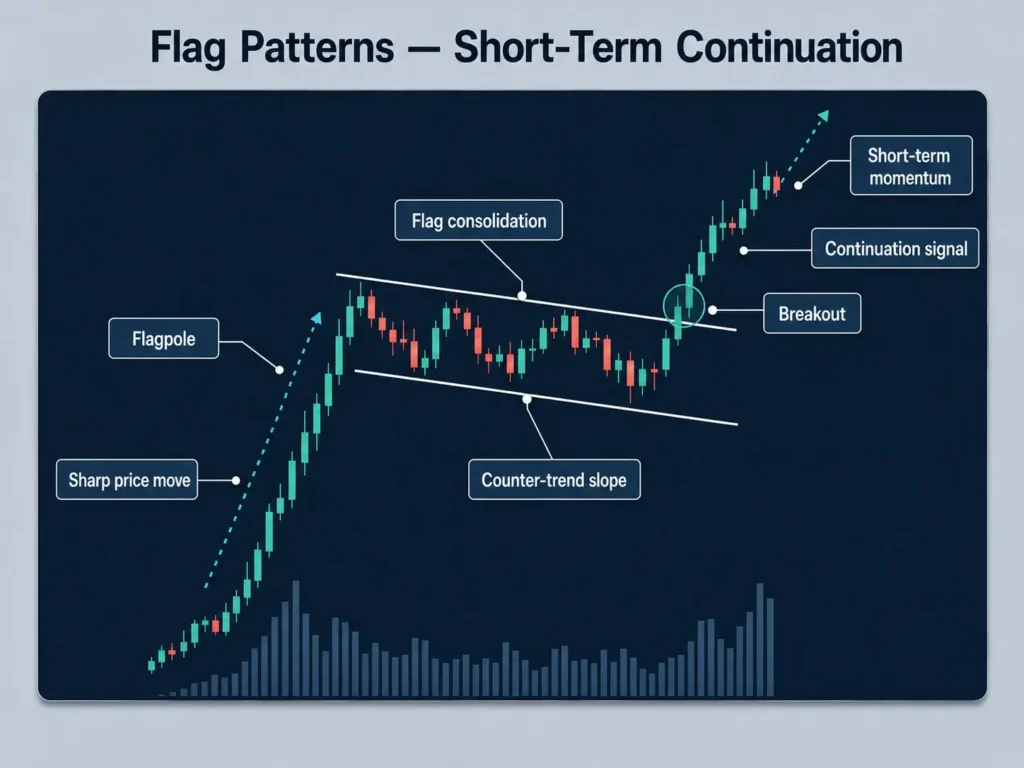
Flags are commonly interpreted as short-term continuation signals and are often observed by intraday traders interested in momentum. A breakout from the flag is usually interpreted as a potential continuation, though the outcome may vary.
Key features:
- Small rectangular consolidation that slopes against the preceding trend
- Forms after a sharp, near-vertical price move (the ‘flagpole’)
- Breakout typically continues in the direction of the original flagpole move
- Most often used by short-term and intraday traders monitoring momentum
9. Pennant Patterns — Compact Continuation
Pennants are similar to flags but form a small triangular rather than rectangular shape. After a steep price movement, price consolidates into a small symmetrical triangle that slopes neither clearly up nor down.
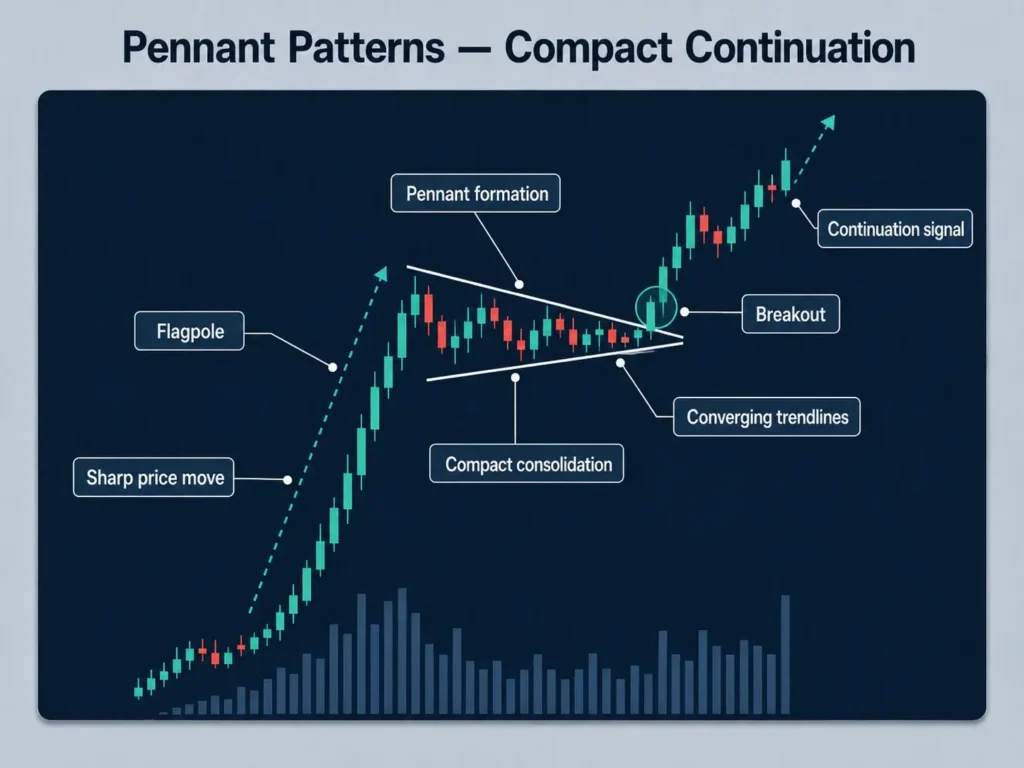
Like flags, pennants represent a pause before the previous trend resumes. They are shorter in duration and sharper in formation than larger triangles, making them a formation some traders monitor when assessing possible short-term continuation.
A breakout from the pennant is commonly viewed as a possible continuation, but this is not always the case.
Key features:
- Small symmetrical triangle that forms after a sharp price move
- Shorter in duration than a standard Symmetrical Triangle
- Breakout typically continues in the direction of the move that preceded it
- Easily confused with flags — the triangular shape is the main distinguishing feature
10. Cup and Handle — Bullish Continuation
The Cup and Handle is a bullish continuation pattern that often appears in equities during long-term uptrends.
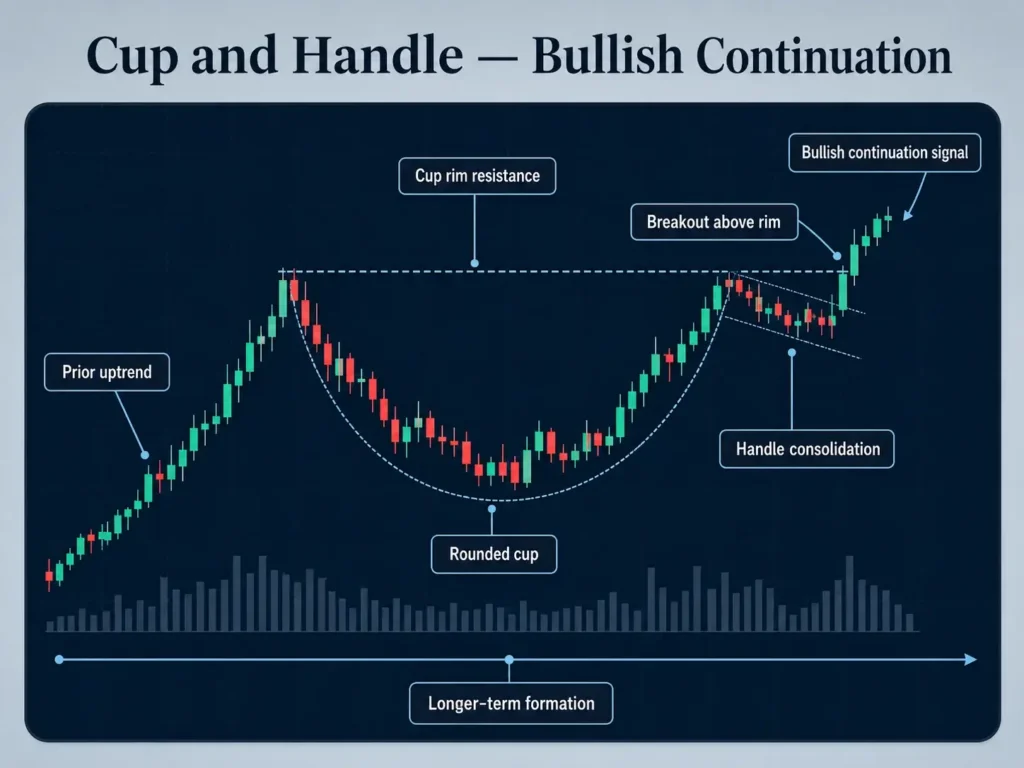
The ‘cup’ looks like a rounded bottom, showing a gradual shift from selling to buying interest. After this slow recovery, a small pullback forms the ‘handle,’ usually a short consolidation before a breakout higher.
Once price clears the resistance at the rim of the cup, traders may interpret the pattern as confirmed, though it may still fail. Some traders value this setup because it is often associated with sustained bullish trends in equity CFDs, though outcomes may vary.
Key features:
- Rounded ‘cup’ base followed by a shorter ‘handle’ consolidation
- Breakout above the cup’s resistance rim is the standard confirmation signal
- Most associated with long-term uptrends in individual equities
- Can take weeks to months to complete on higher timeframes
How a Real Chart Pattern Played Out: Gold’s 2026 Head and Shoulders
Chart pattern mechanics are easier to recognise when matched against a real, dated example rather than a textbook illustration.
In May 2026, spot gold (XAUUSD) formed a Head and Shoulders pattern with a neckline near $4,678 per ounce. According to Reuters, a break of that neckline pointed to a projected move toward roughly $4,601, with resistance for the pattern sitting at $4,714 [1]. Retail traders typically access this kind of price movement in gold through CFDs rather than physical bullion.
The setup illustrates the same mechanics covered earlier in this guide: three peaks, a neckline connecting the lows between them, and a measured target projected from the height of the head. This does not mean every Head and Shoulders pattern resolves exactly as projected — patterns can and do fail, particularly around high-impact news events — but the gold example shows how the formation applies to a live, liquid market rather than a hypothetical chart.
The above example is for illustrative purposes only and does not constitute a recommendation to buy, sell, or hold any financial instrument. Past performance is not a reliable indicator of future results.
How to Trade Chart Patterns Effectively
Recognising and knowing how to read a chart pattern is only the first step; using trading chart patterns effectively requires the discipline to seek confirmation.
One of the most important rules is to wait for confirmation before entering a trade. For example, in a Head and Shoulders pattern, the setup isn’t complete until price breaks below the neckline. Jumping in too early can expose a trader to false signals, where the market appears to form a pattern but doesn’t follow through. Confirmation, often paired with a rise in trading volume, helps filter out potential false setups and may improve the reliability of the analysis.
Chart patterns are generally considered alongside other technical indicators. The Relative Strength Index (RSI) can highlight whether a market is overbought or oversold, while MACD can signal momentum shifts that align with the breakout.
Moving averages are also useful for confirming the broader trend direction. For example, if a bullish Triangle breakout happens above the 200-day moving average, the signal carries more weight than if it happened during a downtrend. Combining chart patterns with these indicators can help build a more complete picture of market conditions.
Another critical aspect of using chart patterns is risk management. No chart pattern or technical indicator is fool-proof, and even well-formed chart patterns can fail, especially in volatile markets.
It is worth using risk-management tools such as stop-loss orders, placed in the right position — for example, just beyond the boundaries of the pattern, such as below the support in a Double Bottom or above the resistance in a Double Top. This way, if the market breaks in the opposite direction, losses are limited.
Position sizing matters too; many traders manage risk by limiting their exposure on individual trades to reduce the impact of potential losses. False breakouts are common, so protecting the downside is as important as spotting the right chart pattern in the first place.
Common Mistakes Traders Make With Chart Patterns
Even though chart patterns are widely used in technical analysis, they are not foolproof. Traders often fall into predictable traps when applying them. Understanding these common mistakes can help in recognising why certain setups fail and why patience and context matter when analysing charts.
1. Entering a Trade Too Early
One of the biggest mistakes traders make is entering too early without confirmation. When a potential pattern begins to form, it can be tempting to place a trade in the direction the pattern appears to indicate.
However, this can be a mistake — until the breakout occurs, the pattern is incomplete. Premature entries often lead to being caught in false setups, where price briefly teases the pattern before snapping back in the opposite direction.
Patience is key — waiting for confirmation gives the pattern validity and reduces the chances of chasing noise.
2. Ignoring Timeframe Relevance
Another common pitfall is ignoring timeframe relevance. Chart patterns can appear on any timeframe, from one-minute charts to weekly charts, but not all carry the same significance.
A Head and Shoulders pattern forming on a daily chart represents weeks of market activity and reflects the consensus of many traders and institutions, which makes the signal more reliable. By contrast, the same pattern on a five-minute chart may only reflect a short burst of volatility or noise, which can reverse just as quickly as it appeared.
Traders who rely only on short-term setups without considering the bigger picture risk making trades that go against the dominant trend. Aligning smaller patterns with higher-timeframe trends usually improves accuracy by filtering out weak signals and favouring trades in the direction where momentum is strongest.
3. Over-Reliance on Chart Patterns
Finally, traders may fall into the trap of over-relying on chart patterns while ignoring fundamentals.
Technical analysis is powerful, but it does not operate in a vacuum. Economic news, earnings reports, central bank decisions, and geopolitical events can all invalidate a pattern within seconds.
A clean Triangle Breakout in a forex pair can fail instantly if unexpected interest rate news hits the market. Combining technical signals with awareness of market fundamentals — the focus of fundamental analysis — helps ensure decisions are grounded in both price action and real-world context.
Making Chart Patterns Work for You
Chart patterns give traders a window into the psychology of the market. They illustrate where buyers appear to step in, where sellers hold ground, and where momentum may be shifting beneath the surface. Learning to read these formations is what separates anticipating a move from simply reacting to it after the fact.
That said, chart patterns are not crystal balls. They tend to work best when combined with confirmation signals, sound risk management, and a healthy respect for market fundamentals — the same principles that apply whether someone is trading chart patterns in forex, indices, or commodities.
As you study chart patterns, you will not only recognise the shapes on the chart but also understand the emotions driving them — fear, greed, hesitation, and conviction — which can support a more informed approach to trading. For more on related topics, including candlestick patterns and fundamental analysis, see the rest of the Vantage Academy.
Frequently Asked Questions
How many chart patterns are there?
There is no single fixed number, since traders and analysts have documented many variations of the same core formations over the decades. This guide focuses on the 10 patterns most commonly referenced across forex, stocks, indices, and commodity CFDs — Head and Shoulders, Inverse Head and Shoulders, Double Top, Double Bottom, Ascending and Descending Triangles, Symmetrical Triangle, Flags, Pennants, and Cup and Handle — though some traders also study less common variants such as rounding tops and wedges.
What is the difference between continuation, reversal, and bilateral chart patterns?
Continuation patterns, such as flags and triangles, suggest a pause before the existing trend resumes. Reversal patterns, such as Head and Shoulders or Double Tops, suggest a trend may be losing momentum and turning the other way. Bilateral patterns, such as the Symmetrical Triangle, reflect genuine uncertainty — the breakout direction is not predetermined by the pattern itself.
How do you read a chart pattern?
Reading a chart pattern starts with identifying the shape forming from connected swing highs and lows, then locating the relevant support, resistance, or neckline level. From there, most traders wait for a confirmed breakout — a close beyond that level — rather than acting on the shape alone, and often check whether trading volume rises alongside the breakout for added confirmation.
How do you draw chart patterns on a chart?
Chart patterns are typically drawn using trendlines: a line connecting swing highs marks resistance, and a line connecting swing lows marks support. For reversal patterns like Head and Shoulders or Double Tops, a separate neckline is drawn by connecting the interim lows or highs between the peaks or troughs that make up the pattern.
What is the difference between chart patterns and candlestick patterns?
Chart patterns form over many price bars or candles — sometimes weeks or months — and are defined by trendlines connecting multiple swing highs and lows, such as a Head and Shoulders or a Triangle. Candlestick patterns, by contrast, form from one or a handful of individual candles and are read over a much shorter window. The two are often used together rather than as substitutes for one another.
What is the most reliable chart pattern?
No chart pattern is reliable in every market condition, and past performance is not a reliable indicator of future results. That said, Head and Shoulders, Double Tops, and Double Bottoms are among the most widely studied reversal patterns, largely because their structure — a clear neckline and a measurable target — has stayed consistent across decades of charting practice. Many traders still treat a confirmed breakout, ideally supported by rising volume, as more important than the pattern type itself.
Reference
- “Spot gold targets $4,601 after head-and-shoulders completion – Reuters” https://www.tradingview.com/news/reuters.com,2026:newsml_L1N41O02A:0-spot-gold-targets-4-601-after-head-and-shoulders-completion/ Accessed 30 June 2026