


Brent Crude Oil and WTI Prices Drop 12% in a Week — What the Iran Deal Means for Oil Prices Today

Vantage Editorial Team >
Vantage Editorial Team >
Vantage is a global, multi-asset broker with a team of in-house writers and market analysts who produce educational and insightful trading content for traders of all levels.
 Updated Tue, 2026 May 26 05:16

Crude oil prices today are at a five-week low. Brent oil (UKOUSD) is near $98.09 and WTI crude oil (USOUSD) near $94.49 as of 01:20 (UTC) on 26 May 2026 — down roughly 12% from where both opened on Monday. This is one of the sharpest weekly declines for oil prices since the conflict escalated earlier this year.
The commodity market news driving the move is one theme: Iran-US diplomacy. The brent crude oil price tumbled nearly 6% on 25 May after Iran submitted a diplomatic proposal to mediators,[1] while ship-tracking data indicated a gradual easing in regional shipping disruptions, with several LNG tankers transiting the Strait of Hormuz en route to Pakistan, China, and India.[7] Markets interpreted both as a signal that reduced disruption risk around the Strait of Hormuz was becoming more likely. The oil news today reflects caution: both sides are sending mixed signals, and Iran’s nuclear programme remains an unresolved issue.
This article runs through the oil price chart for both Brent and WTI, the crude oil price drivers behind this week’s move, and what to watch ahead. All prices are as of 01:20 (UTC) on 26 May 2026. Charts are indicative and from TradingView. This is not financial advice.
Key Points
- The brent crude oil price (UKOUSD) fell nearly 6% on 25 May to close near $96.16, its lowest since April 2026 — before recovering to $98.09 by the 26 May open.[1] The week opened near $112.03, making the weekly range more than $15.
- WTI (USOUSD) crude oil prices today are near $94.51, having touched an intraday low near $92.30 on 25 May.[2] Trading Economics data shows WTI crude oil remains approximately 50% above year-ago levels despite the week’s decline.[2]
- Diplomatic developments are currently dominating short-term crude oil price action despite ongoing supply tightness. US crude inventories fell for a fifth consecutive week per the EIA,[3] and the next scheduled commodity market news on output policy is the OPEC+ ministerial meeting on 7 June 2026.
Oil price chart: how Brent and WTI traded this week
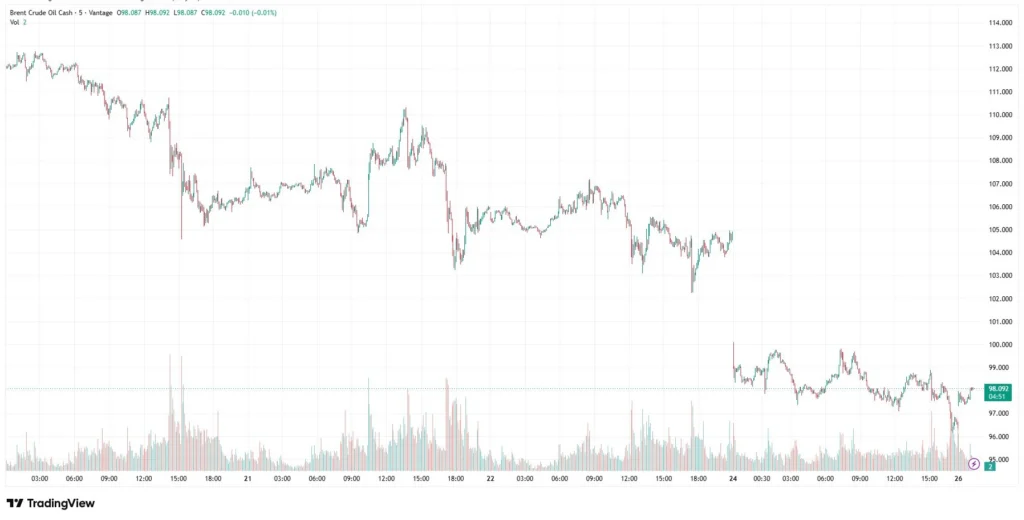
The oil price chart for both Brent crude oil and WTI this week tells one consistent story: a steady grind lower from Monday’s open, an accelerating drop on 25 May when the Iran talks headlines landed, and a partial recovery into the 26 May open. Both oil prices moved in lockstep. The Brent-WTI spread held broadly stable throughout, confirming a shared macro driver.
Brent crude oil price (UKOUSD): $113.50 to below $96 in five sessions
The brent oil price chart (UKOUSD) opened near $112.03 on 20 May and declined steadily. A brief recovery to around $110.18 on 21 May gave way to further losses into the $102 to $105 range by 23 May. The 25 May session saw the sharpest move: the brent crude oil price touched near $96 intraday before closing around $96.49.[1] Trading activity spiked sharply during that session, visible at the base of the oil price chart. The brent crude oil price has since recovered to $98.09.
WTI crude oil (USOUSD): intraday low near $91.50, crude oil prices today at $94.49
The WTI crude oil price (USOUSD) followed the same path on the oil price chart. Opening near $108 on 20 May, WTI drifted through the $99 to $101 range by 22 to 23 May, then dropped sharply on 25 May to an intraday low near $92.29 before recovering.[2] Trading activity accelerated sharply during the 25 May session — the highest of the week on the oil price chart. WTI crude oil prices today sit at $94.51, with $92.29 the most relevant near-term reference on the chart.

What’s behind the oil news this week
Iran-US diplomatic talks — the oil news today that moved markets
The oil news today dominating commodity market news is the Iran-US diplomatic track. Iran submitted a diplomatic proposal to mediators in Pakistan on 25 May,[1] and ship-tracking data indicated a gradual easing in regional shipping disruptions, with several LNG tankers transiting the Strait of Hormuz en route to Asian destinations.[7]
Markets priced a higher probability of reduced disruption risk around the Strait of Hormuz, sending the brent crude oil price below $98 and WTI below $91 intraday. The recovery into 26 May reflects continuing uncertainty: Iran’s Foreign Ministry confirmed a consensus on many topics but said signing was not imminent, while Trump stated the deal would be great or would not happen.[5] Iran’s nuclear programme and maritime authority over the Strait remain the key unresolved issues.
Inventories and OPEC+ — the supply picture remains tight
The commodities news on the supply side is unchanged. The EIA reported US crude inventories fell for a fifth consecutive week.[3] The EIA’s May 2026 STEO — published 12 May 2026 — projects Q2 2026 global inventory draws averaging 8.5 mb/d, citing extreme tightness caused by the Strait of Hormuz disruption.[4,8]
The same report assessed that Iraq, Saudi Arabia, Kuwait, the UAE, Qatar, and Bahrain collectively shut in 10.5 mb/d of crude production in April, with peak shut-ins expected to reach approximately 10.8 mb/d in May.[4] OPEC+ confirmed a 188,000 bpd output increase for June — a largely symbolic adjustment given that Hormuz-constrained producers cannot yet deliver additional barrels to market.[6] Diplomatic developments are currently dominating short-term crude oil price action; the underlying supply tightness has not changed.
Dollar direction — the secondary layer on crude oil prices
Crude oil prices carry an inverse relationship with the US dollar. As Iran diplomacy news grew, markets also considered a scenario in which stabilisation of shipping conditions through the Strait of Hormuz could reduce some energy-driven inflation pressure expectations. The DXY has not strengthened meaningfully this week, limiting additional currency-side pressure on oil prices. Leverage in oil CFDs means potential returns and losses move quickly when geopolitical and macro factors shift simultaneously.
Key levels on the crude oil price chart
Reference levels as of 01:20 (UTC) on 26 May 2026. Not trade signals.
| Instrument | Weekly low | Weekly high | Current level | Watch |
| Brent (UKOUSD) | ~$96.00 | ~$113.50 | ~$98.07 | Iran talks |
| WTI (USOUSD) | ~$92.29 | ~$108.00 | ~$94.51 | $91 reference |
Table 1: Weekly crude oil price reference levels as of 01:20 (UTC) on 26 May 2026. Sources: TradingView, Trading Economics, CNBC. Indicative only.
For Brent crude oil (UKOUSD), $96.00 was the 25 May intraday low and the nearest downside reference on the oil price chart. $113.50 marks the week’s open and the most significant resistance. For WTI (USOUSD), $92.29 was the 25 May intraday low; $108 was the weekly high. Both oil prices are reacting to diplomatic headlines within minutes. In this environment, risk parameters may need reassessment as the intraday range assumptions that applied before the diplomatic headlines this week have materially shifted.
What to watch: the oil news that could move crude oil prices next
These are the events most likely to generate oil news and shift crude oil prices in the near term:
- US-Iran diplomatic talks, Ongoing: The central variable for oil news today and next week. A confirmed agreement leading to reduced disruption risk around the Strait of Hormuz would be major commodity market news. A breakdown in talks would reinforce the supply tightness story.
- EIA crude inventories, 28 May 2026: Inventories have fallen five weeks in a row. A sixth consecutive draw reinforces the undersupply case; a build would be the first softening signal in weeks.
- OPEC+ ministerial meeting, 7 June 2026: Next review of output policy. The UAE’s departure has reduced OPEC+ spare capacity estimates. Any revision to the 188,000 bpd June hike would be commodity market news.
- Strait of Hormuz shipping conditions, Ongoing: Ship-tracking data has indicated some gradual easing in regional disruptions. Any sustained improvement in shipping conditions — or fresh deterioration — would directly move both the brent crude oil price and WTI.
The brent crude oil price and WTI crude oil prices both absorbed a 6% drop on 25 May and partially recovered into 26 May. The oil price chart going into this week shows a market that moved sharply on diplomatic developments and is now waiting for confirmation of any shift in Strait of Hormuz shipping conditions.
Traders active in oil CFDs are operating in conditions of elevated intraday volatility, where risk parameters may need reassessment as headline-driven gaps can move crude oil prices significantly in short windows. Traders holding correlated positions across gold (XAUUSD) and energy-linked pairs should review combined exposure accordingly.
Leverage amplifies both potential returns and losses in a market where a single headline can move crude oil prices 6% in one session. Position sizing relative to account equity is worth revisiting before the EIA print on 28 May and any developments in Iran-US diplomatic talks — both are capable of generating fresh oil news today and repricing Brent and WTI sharply.
RISK WARNING: CFDs are complex financial instruments and carry a high risk of losing money rapidly due to leverage. You should ensure you fully understand the risks involved and carefully consider whether you can afford to take the high risk of losing your money before trading.
Disclaimer: The information is provided for educational purposes only and does not take into account your personal objectives, financial circumstances, or needs. It does not constitute investment advice. We encourage you to seek independent advice if necessary. The information has not been prepared in accordance with legal requirements designed to promote the independence of investment research. No representation or warranty is given as to the accuracy or completeness of any information contained within. This material may contain historical or past performance figures and should not be relied on. Furthermore, estimates, forward-looking statements, and forecasts cannot be guaranteed. The information on this site and the products and services offered are not intended for distribution to any person in any country or jurisdiction where such distribution or use would be contrary to local law or regulation.
References
[1] “Brent crude oil price — Trading Economics” https://tradingeconomics.com/commodity/brent-crude-oil Accessed on 26 May 2026.
[2] “Crude Oil price and historical data — Trading Economics” https://tradingeconomics.com/commodity/crude-oil Accessed on 26 May 2026.
[3] “Short-Term Energy Outlook May 2026 — US Energy Information Administration” https://www.eia.gov/outlooks/steo/ Accessed on 26 May 2026.
[4] “Short-Term Energy Outlook May 2026 full report — US Energy Information Administration” https://www.eia.gov/outlooks/steo/pdf/steo_full.pdf Accessed on 26 May 2026.
[5] “US crude oil falls below $100 after Trump says Iran talks in final stages — CNBC” https://www.cnbc.com/amp/2026/05/20/oil-price-today-iran-war-strait-hormuz-trump.html Accessed on 26 May 2026.
[6] “OPEC+ announces 188,000 barrels-per-day output increase — CNBC” https://www.cnbc.com/2026/05/03/opec-announces-188000-barrels-per-day-output-increase-.html Accessed on 26 May 2026.
[7] “OPEC+ announces symbolic oil output rise during Strait of Hormuz closure — Al Jazeera” https://www.aljazeera.com/news/2026/5/3/opec-announces-symbolic-oil-output-rise-during-strait-of-hormuz-closure Accessed on 26 May 2026.
[8] “EIA sees oil deficit widening in 2026 — Rigzone” https://www.rigzone.com/news/eia_sees_oil_deficit_widening_in_2026-18-may-2026-183711-article/ Accessed on 26 May 2026.