The Analyst’s Read: Crude Oil Prices at $74 – The Peace Trade Is Outrunning a Messy Hormuz Reopening
Vantage Editorial Team >
Vantage Editorial Team >
Vantage is a global, multi-asset broker with a team of in-house writers and market analysts who produce educational and insightful trading content for traders of all levels.
Crude oil prices today tell a strange story. Brent (UKOUSD) was trading near $74.73 as of 13:00 (GMT+8) on 26 June 2026 – effectively back to where it sat before the Middle East conflict began in late February. At the peak in March, Brent crude oil price traded above $120. The market has unwound almost the entire war premium. And yet the Strait of Hormuz is not fully normalised, a cargo vessel was struck off Oman just yesterday, and OPEC+ is adding barrels regardless.
All prices and chart readings are as of 13:00 (GMT+8) on 26 June 2026. This is not financial advice.
Key Points
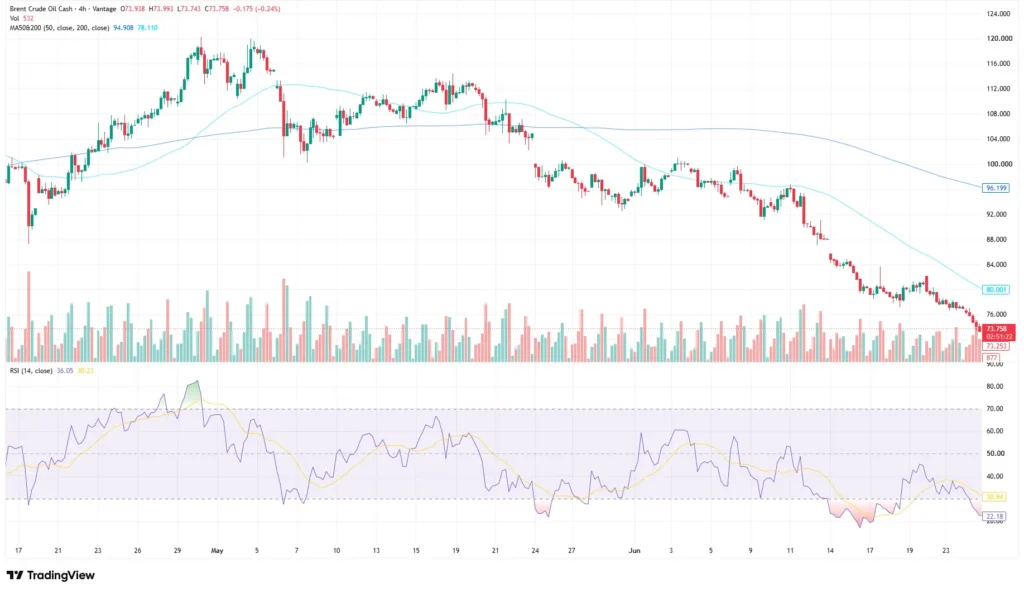
- Brent crude oil prices (UKOUSD) were near $74.73 as of 13:00 (GMT+8) on 26 June, sitting roughly 38% below the March conflict peak. Both MAs on the 4-hour chart are declining steeply above price – MA50 at 95.53, MA200 at 78.75 – a structurally bearish configuration.
- The RSI on the TradingView setup used for this analysis reads 36.41, with the RSI moving-average overlay at 30.60. RSI crossed above its overlay this week – a slowing of momentum, not evidence of a structural floor.
- OPEC+ implemented a scheduled increase in production of approximately 188,000 barrels per day in June with another tranche planned for July, Iranian oil is returning under a US Treasury waiver, and the EIA now expects global oil demand growth to weaken sharply in 2026, with demand projected to be roughly 1.1 million barrels per day lower than its previous forecast of modest growth. The chart and the macro are pointing the same direction.
What the Oil Price Chart Is Showing
The 4-hour UKOUSD brent oil chart tells a clean story. Crude oil prices peaked above $120 in mid-March, then fell in a series of sharp legs through April and into May as ceasefire talks progressed, with sellers returning each time buyers tried to establish a base. See all latest crude oil news.
As of the cut-off time, the MA50 sits at 95.53 and the MA200 at 78.75, both well above current price and both declining. Price has been trading below the MA200 for several weeks. That configuration continues to favour a bearish medium-term technical outlook.
The RSI on the TradingView setup used for this analysis reads 36.41, with the RSI moving-average overlay at 30.60. RSI crossed above its overlay earlier this week, which some traders read as a tentative signal that the pace of selling has slowed. I interpret this as evidence of slowing downside momentum rather than confirmation of a durable trend reversal. The RSI remains below 40, suggesting bearish momentum is still dominant despite the recent improvement.
The Macro Backdrop: Supply Returning, Demand Under Pressure
First, Middle East oil supply is returning faster than most expected. Saudi Arabian tankers resumed heading toward the Ras Tanura terminal this week to restart Persian Gulf exports for the first time since March. The US Treasury issued a 60-day general licence authorising transactions involving Iranian-origin crude oil and petroleum products, effective until 21 August 2026.[1]
Second, OPEC+ has pressed ahead with output increases regardless of the geopolitical backdrop. Seven core OPEC+ members implemented a scheduled increase in production of approximately 206,000 barrels per day in May and approximately 188,000 barrels per day in June, with another 188,000 barrel-per-day increase planned for July.[2]
Third, oil demand is weakening. The EIA now expects global oil demand growth to weaken sharply in 2026, with demand projected to be roughly 1.1 million barrels per day lower than its previous forecast of modest growth.[3] Natasha Kaneva, Head of Global Commodities Strategy at J.P. Morgan, noted that supply surpluses were visible in early-2026 data and expected to persist.[4] Post-conflict, with Middle East supply recovering, that surplus math only gets heavier.
What complicates this picture is the Strait of Hormuz. The conflict formally ended when the US and Iran signed a memorandum of understanding on 17 June 2026.[5] But a cargo ship was struck by an unidentified projectile off the Omani coast on 25 June.[6] Insurance rates remain elevated and major shipping lines have yet to fully normalise transit patterns.
Check out this guide about oil trading.
Where the Chart and the Macro Agree – and Where They Don’t
Here is where I land: the chart and the macro are directionally aligned, but the market appears to be pricing the supply recovery faster than the physical recovery is actually occurring.
The oil price chart continues to indicate persistent selling pressure over the past three months. Every bounce since the March peak has been faded. From a pure chart-reading standpoint, the path of least resistance on crude oil prices has been lower.
The macro agrees directionally, but Brent trading near $74, effectively at pre-conflict levels, is pricing a completion of the supply recovery that has not happened yet. Saudi Aramco CEO Amin Nasser warned in May that full market normalisation would take until 2027 even if the Strait opened immediately.[7] Any disruption to Hormuz transit – another vessel incident, a diplomatic setback – could generate a sharp short-covering move within that broader downtrend. That distinction matters for how exposure is managed.
Crude Oil Price Levels to Watch and Risk Framing
| Instrument | Support | Resistance | What the chart shows |
| UKOUSD (Brent crude oil) | $70.00 / $72.00 | $78.75 (MA200) / $80.00 | Below both MAs; RSI 36.41 |
Table 1: Key crude oil price levels as of 13:00 (GMT+8), 26 June 2026. Source: TradingView (UKOUSD 4H chart). Indicative only.
The MA200 at 78.75 is the level I keep returning to. Brent crude tested that zone in mid-June and failed to hold above it. If the supply recovers, the MA200 becomes relevant again as a zone traders may watch on any recovery attempt. On the downside, $72–$70 is where oil prices today sit relative to pre-conflict levels, an area where buyers may begin to emerge.
What to Watch
- Hormuz shipping data, ongoing: Daily AIS-tracked transits are the most immediate oil news signal, more informative than headline statements on negotiations.
- EIA Petroleum Status Report, 2 July 2026: Cushing stocks are already below operational requirements at roughly 19 million barrels. Any further drawing could disrupt the surplus narrative quickly.
- OPEC+ July output decision, early July 2026: Another 188,000 barrel-per-day increase is flagged. If delayed or reversed, that shifts the supply picture materially.
- US-Iran permanent deal talks: The 60-day memorandum of understanding runs through mid-August. Breakdown in nuclear policy talks is the highest-magnitude risk to crude oil prices today.
This is a market that has moved fast and priced a lot of good news. Stop Loss discipline matters here because RSI momentum divergence and unresolved Hormuz uncertainty create conditions where short-covering moves can be sharp and fast even within a broader downtrend. Traders monitoring UKOUSD and USOUSD should size exposure relative to the intraday range on these instruments, which remains elevated. The MA200 at $78.75 and the $72–$70 zone are the structural references worth knowing before oil news moves the tape.
Leverage in CFD trading on crude oil instruments is a double-edged tool. The same mechanism that amplifies returns on a correct read also amplifies losses when the market moves against a position. In an environment where geopolitical headlines can shift crude oil prices several dollars in minutes, position sizing relative to account equity deserves attention before each session, not after a move has already started.
RISK WARNING: CFDs are complex financial instruments and carry a high risk of losing money rapidly due to leverage. You should ensure you fully understand the risks involved and carefully consider whether you can afford to take the high risk of losing your money before trading.
Disclaimer: The information is provided for educational purposes only and doesn’t take into account your personal objectives, financial circumstances, or needs. It does not constitute investment advice. We encourage you to seek independent advice if necessary. The information has not been prepared in accordance with legal requirements designed to promote the independence of investment research. No representation or warranty is given as to the accuracy or completeness of any information contained within. This material may contain historical or past performance figures and should not be relied on. Furthermore estimates, forward-looking statements, and forecasts cannot be guaranteed. The information on this site and the products and services offered are not intended for distribution to any person in any country or jurisdiction where such distribution or use would be contrary to local law or regulation.
References
[1] “Oil prices today: Brent, WTI rise as Iran tensions escalate – CNBC” https://www.cnbc.com/2026/06/22/oil-prices-wti-brent-crude-trump-iran-threat-strait-hormuz-closure.html Accessed on 26 June 2026.
[2] “OPEC+ announces 188,000 barrels-per-day output increase in first meeting without UAE – CNBC” https://www.cnbc.com/2026/05/03/opec-announces-188000-barrels-per-day-output-increase-.html Accessed on 26 June 2026.
[3] “Short-Term Energy Outlook – US Energy Information Administration” https://www.eia.gov/outlooks/steo/ Accessed on 26 June 2026.
[4] “Oil Price Forecast for 2026 – J.P. Morgan Global Research” https://www.jpmorgan.com/insights/global-research/commodities/oil-prices Accessed on 26 June 2026.
[5] “Brent rises after US-Iran peace talks in Geneva are abruptly postponed – CNBC” https://www.cnbc.com/2026/06/19/oil-prices-wti-brent-crude-us-iran-deal-strait-hormuz-shipping-recovery.html Accessed on 26 June 2026.
[6] “Brent crude oil – Price – Chart – Historical Data – News – Trading Economics” https://tradingeconomics.com/commodity/brent-crude-oil Accessed on 26 June 2026.
[7] “Oil drops 20% from 2026 peak on optimism over US-Iran ceasefire talks – CNBC” https://www.cnbc.com/2026/05/29/oil-prices-iran-ceasefire-us-trump-strait-hormuz-energy-costs.html Accessed on 26 June 2026.
