Brent Crude Oil and WTI Price Outlook — Week of 11–15 May 2026: Hormuz, the IEA Warning, and What Comes Next
Vantage Editorial Team >
Vantage Editorial Team >
Vantage is a global, multi-asset broker with a team of in-house writers and market analysts who produce educational and insightful trading content for traders of all levels.
Brent crude oil (UKOUSD) is near $109.33 and WTI oil (USOUSD) near $102.40 as of 02:10 (UTC) on 15 May 2026, up more than 7% on the week. The driver is straightforward: the Strait of Hormuz is still heavily restricted, The IEA described the current inventory drawdown as among the fastest on record outside pandemic conditions,[1] and Saudi Arabia’s output has fallen to its lowest level since 1990. Charts are sourced from TradingView and are indicative only. This is not financial advice.
Key Points
- Brent crude oil hit a weekly high near $111 before easing to $109.33. Global oil inventories drew by a combined 246 million barrels across March and April, roughly 4 mb/d in Q2, the fastest rate ever recorded outside a pandemic.[1]
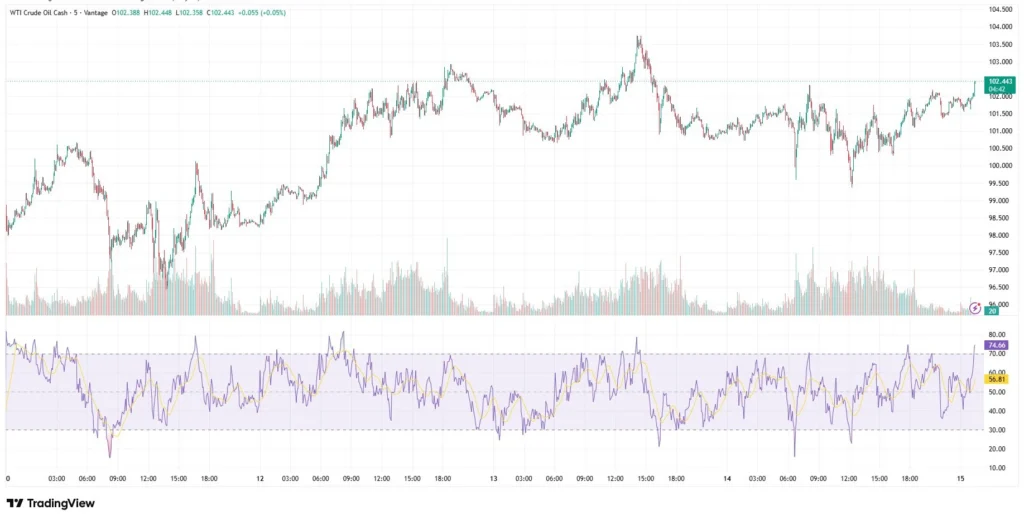
- WTI oil ranged from ~$98.50 to $104 and is near $102.40. The RSI fast line is at 74.66, a level where momentum has tended to pause before deciding its next direction.[2]
- Strait of Hormuz flows have dropped from over 20 mb/d to around 3.8 mb/d. The IEA described the disruption as one of the largest modern oil-market supply shocks and the Strait is still not fully open.[3]
Brent crude oil and WTI oil: what the charts showed this week
Both charts ran the same pattern: a push higher on Tuesday and Wednesday, a local top in the 13–14 May Asia session, a pullback, and a partial recovery into 15 May. The Brent-WTI spread stayed stable throughout. One driver, two instruments moving in sync.
WTI oil price: $100 held, RSI fast line at 74.66
WTI ranged from ~$98.50 to $104 and settled into a $100.50–$103 corridor. Buyers defended the $100 level on every intraday test. The RSI fast line at 74.66 versus a slow line at 56.81 is the chart signal worth noting: the fast line is stretched, the slow line is not. Previous readings in this combination have typically preceded a consolidation pause rather than a reversal.
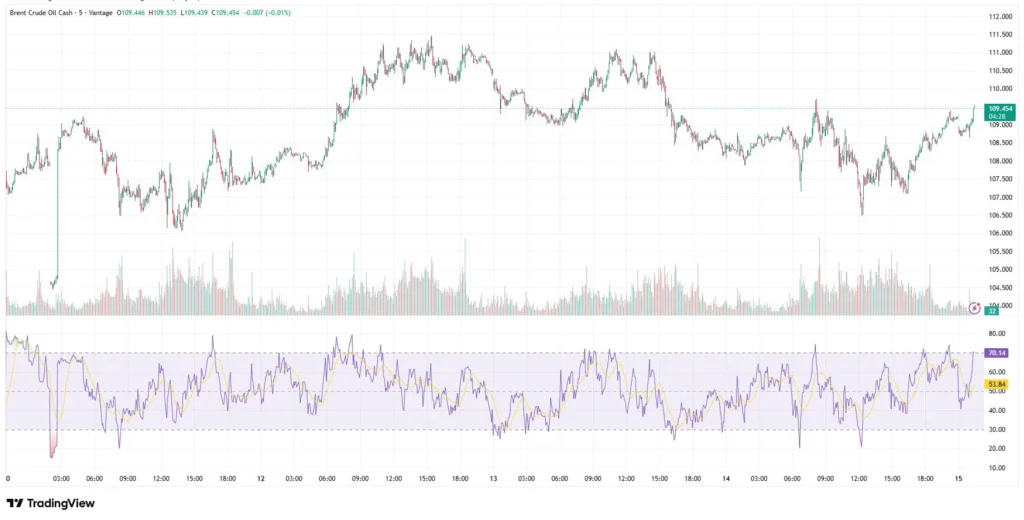
Brent crude oil price: buyers stepped in at $107.50
Brent opened the week near $105, ran to $111, pulled back to $107.50 on 14 May, and has since recovered to $109.33. RSI fast at 70.14 is touching the overbought boundary; slow at 53.84 still has room. No breakdown, no new high, just a market digesting a big move.
Why oil prices climbed this week
IEA May 2026 report: 246 million barrels gone in two months
The IEA’s May 2026 Oil Market Report, published 13 May, put hard numbers on the supply picture: 129 million barrels drawn in March, another 117 million in April.[1] That is 4 mb/d in Q2. The IEA said the market will remain severely undersupplied through Q3 2026 even if the conflict ends by early June, and separately noted that Saudi Arabia’s output has fallen to its lowest since 1990. These figures were published in the IEA’s May 2026 report.
Strait of Hormuz: from 20 mb/d to 3.8 mb/d
Before the conflict, the Strait of Hormuz carried more than 20 mb/d, about one-fifth of all seaborne oil trade.[3] By early April, flows had dropped to around 3.8 mb/d. Alternative routes via Saudi Arabia’s west coast and Fujairah in the UAE can handle at most 5.5 mb/d combined, not enough to close the gap. The IEA report states that the cumulative losses have passed one billion barrels, with over 14 mb/d of Gulf production shut in. As of 15 May, around 30 vessels reportedly crossed the Strait in recent hours. Partial, not resolved.
EIA inventory draw and a weaker dollar
The EIA’s latest weekly report showed US crude stocks fell 4.3 million barrels — nearly double expectations.[4] A near-term demand signal on top of the supply story. The DXY is also near 10-week lows around 97.84,[5] giving dollar-priced commodities a quiet tailwind all week. If the dollar recovers, that support fades. Leverage in oil CFDs means both potential returns and losses can move quickly when several forces are pointing the same way.
WTI crude oil and Brent crude oil: price levels to follow
Reference levels as of 02:10 (UTC) on 15 May 2026. Not trade signals.
| Instrument | Weekly low | Weekly high / resistance | RSI fast / slow | Key watch |
| WTI (USOUSD) | ~$98.50 | $103.50 / $104.00 | 74.66 / 56.81 | EIA data |
| Brent (UKOUSD) | ~$104.50 | $110.50 / $112.00 | 70.14 / 53.84 | Hormuz news |
Table 1: Weekly reference levels as of 02:10 (UTC) on 15 May 2026. Sources: TradingView, Investing.com, Forex.com. Indicative only.
WTI: $100.00 held as the intraday floor on two tests. $103.50–$104.00 capped the 13 May rally. Brent: $107.50 was the 14 May low; $110.50–$112.00 marked the week’s highs. With both benchmarks reacting to Hormuz headlines within minutes, many traders may monitor those weekly levels closely for risk management.
What to watch for the week ahead
| Event | Date | Why it matters |
| EIA crude inventories | 21 May 2026 | Last week drew 4.3 mb, nearly double expectations. A repeat adds more weight to the undersupply case |
| Strait of Hormuz | Ongoing | Any reopening or further closure will move both benchmarks fast. The number one variable right now |
| FOMC minutes | ~20 May 2026 | A weaker dollar has been supporting oil. Minutes will show how divided the Fed actually is |
| Trump-Xi summit | Mid-May 2026 | Trade talks could shift Chinese crude demand and affect Iranian oil sanctions |
Table 2: Key events for the week ahead. Sources: Investing.com Economic Calendar, EIA, Reuters. As of 15 May 2026.
The EIA report on 21 May is the most immediate scheduled data point for WTI crude oil prices. For Brent, Hormuz still overrides the economic calendar. Traders holding oil alongside gold (XAUUSD) should check combined exposure — both have been moving in the same direction this week. On risk management: the IEA has flagged further volatility ahead of peak summer demand. Reviewing position sizing before next week’s data is a straightforward precaution.
Both crude benchmarks are holding gains amid what market participants view as a major supply disruption. Brent is near $109.33, WTI near $102.40, and the oil market is still waiting on the Strait. Until Hormuz changes, so does the price.
For traders in oil CFDs, next week calls for clear levels and appropriate sizing. Leverage amplifies both the opportunity and the risk in volatile conditions. The EIA report on 21 May and any Hormuz development are the two things most worth tracking.
RISK WARNING: CFDs are complex financial instruments and carry a high risk of losing money rapidly due to leverage. You should ensure you fully understand the risks involved and carefully consider whether you can afford to take the high risk of losing your money before trading.
Disclaimer: The information is provided for educational purposes only and does not take into account your personal objectives, financial circumstances, or needs. It does not constitute investment advice. We encourage you to seek independent advice if necessary. The information has not been prepared in accordance with legal requirements designed to promote the independence of investment research. No representation or warranty is given as to the accuracy or completeness of any information contained within. This material may contain historical or past performance figures and should not be relied on. Furthermore, estimates, forward-looking statements, and forecasts cannot be guaranteed. The information on this site and the products and services offered are not intended for distribution to any person in any country or jurisdiction where such distribution or use would be contrary to local law or regulation.
References
[1] “Oil Market Report — May 2026, International Energy Agency” https://www.iea.org/reports/oil-market-report-may-2026 Accessed on 15 May 2026.
[2] “Crude Oil WTI Futures Historical Data — Investing.com” https://www.investing.com/commodities/crude-oil-historical-data Accessed on 15 May 2026.
[3] “The Middle East and Global Energy Markets — IEA” https://www.iea.org/topics/the-middle-east-and-global-energy-markets Accessed on 15 May 2026.
[4] “Weekly Petroleum Status Report — US Energy Information Administration” https://www.eia.gov/petroleum/supply/weekly/ Accessed on 15 May 2026.
[5] “US dollar to remain stuck in range, dependent on Strait of Hormuz — Reuters poll via Investing.com” https://www.investing.com/news/economy-news/us-dollar-to-remain-stuck-in-range-dependent-on-the-strait-of-hormuz-reuters-poll-4662949 Accessed on 15 May 2026.
[6] “Brent crude oil price — Trading Economics” https://tradingeconomics.com/commodity/brent-crude-oil Accessed on 15 May 2026.
[7] “WTI crude oil price — Trading Economics” https://tradingeconomics.com/commodity/crude-oil Accessed on 15 May 2026.
[8] “Current price of oil as of 12 May 2026 — Fortune” https://fortune.com/article/price-of-oil-05-12-2026/ Accessed on 15 May 2026.
