For some traders and investors, the first trap with gold on TradingView is not technical—it’s actually the search box.
Type ‘gold’ into TradingView and you would likely see spot gold, broker feeds, gold futures, ETFs (exchange-traded funds), and community ideas. That’s why a practical gold TradingView setup starts with the right symbol before any line, indicator, or alert is added.
This comprehensive guide on how to trade gold on TradingView is designed to walk you through the full setup: how to find XAU/USD, choose the right chart feed, apply relevant indicators, set alerts, and connect the analysis to your preferred broker platform for execution (where available).
Key Points
- XAU/USD is the main TradingView symbol traders typically use to track spot gold against the US dollar.
- TradingView can show several gold-related symbols, so the selected data source matters.
- Candlestick structure, timeframe alignment, and key levels usually come before indicators.
- Moving averages, RSI, MACD, and ATR may help filter gold setups, but they do not remove trade risk.
- Gold price alerts are designed to help traders monitor levels without watching charts constantly.
- TradingView analysis can support Vantage execution where broker integration is available for eligible accounts.
- Gold CFDs use leverage, which can amplify potential gains and potential losses.
How to Add XAU/USD To TradingView
Start with the gold instrument, instead of the indicator. For gold analysis, traders usually search for XAU/USD or XAUUSD in TradingView.
Yet, typing ‘gold’ into the search bar can return various gold instruments that behave differently from one another. Case in point: A futures contract, spot gold chart, ETF, and broker-linked CFD feed can all point to gold exposure, but they are not identical.
Step 1: Open TradingView’s Symbol Search
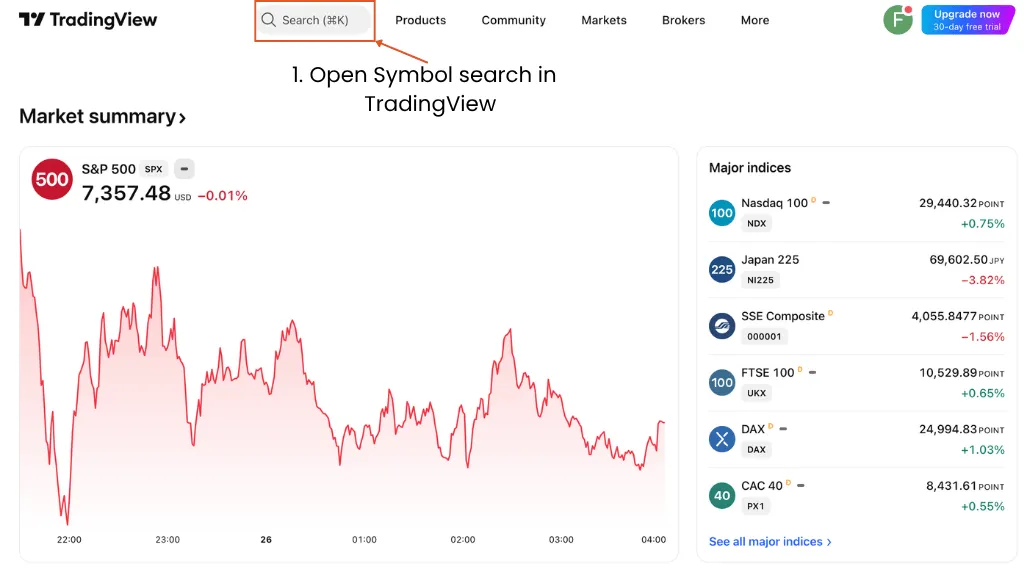
The first step to learning how to trade gold in TradingView is to go to Supercharts and click on the bar at the top left of the screen. TradingView’s Symbol Search is designed to help users find tradeable gold assets by symbol (aka ticker) or term.1
This is where the setup starts. If the wrong symbol is loaded, every support line, moving average, and alert that follows would be based on the wrong feed.
Step 2: Search For XAU/USD
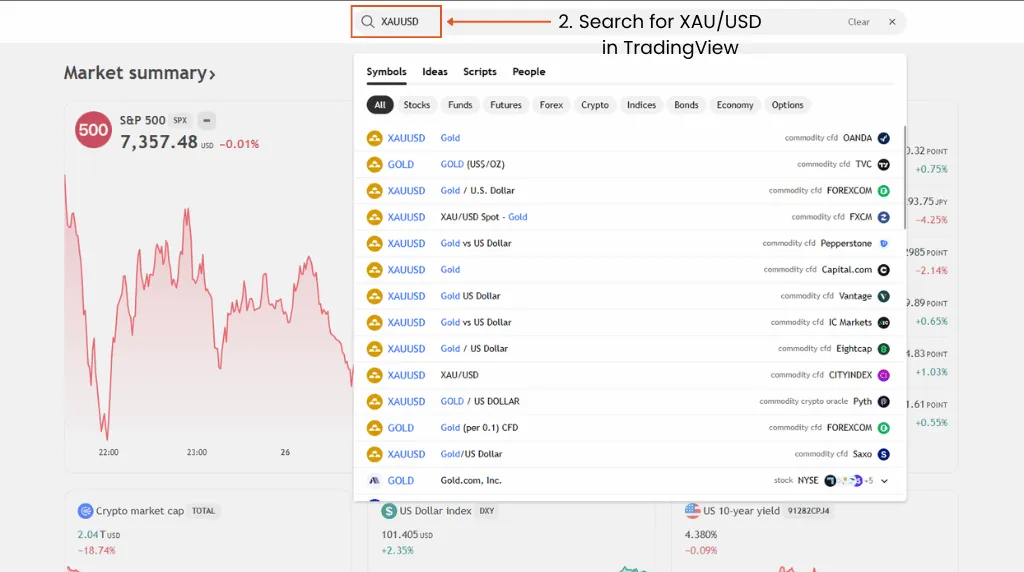
Type ‘XAUUSD’ into Symbol Search. XAU refers to gold, while USD is the quoted currency, so the ticker symbol ‘XAU/USD’ literally means tracking gold priced in US dollars.
For most traders, XAU/USD is oftentimes the cleaner starting point than simply typing ‘gold. It narrows the search from a broad commodity term to the main spot gold pair used in chart analysis.
Step 3: Choose The Right Gold Symbol
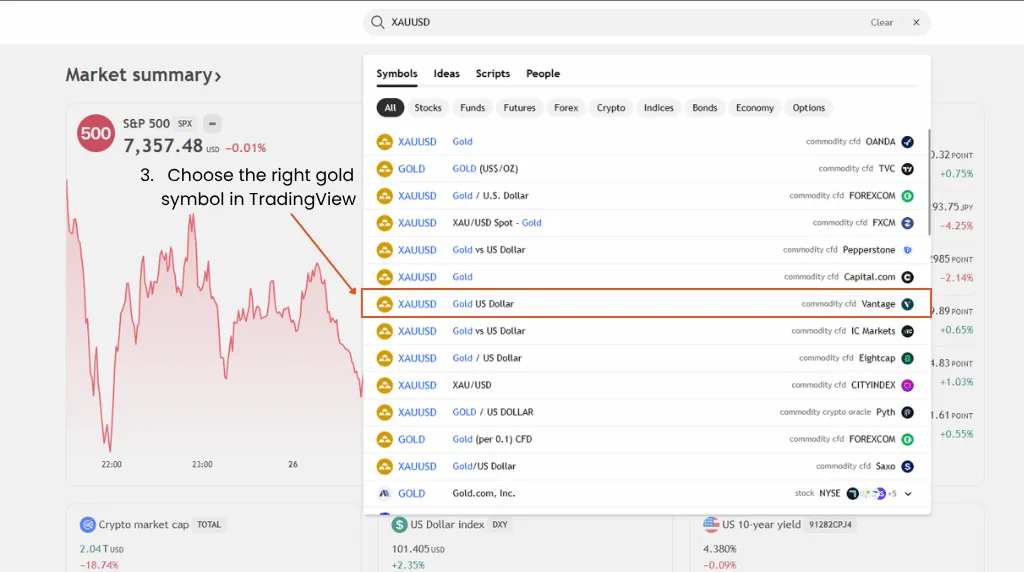
This is the step that stops many bad chart setups before they start. TradingView can show several gold-related instruments, and each one is tailored to different trading styles.
Commonly Seen Gold Symbols on TradingView
| Symbol Type | Example Search | What It Usually Represents | When To Use It |
| Spot Gold | XAUUSD | Gold priced against the US dollar | General gold price analysis |
| Broker Feed | VANTAGE:XAUUSD or similar | A broker-linked gold CFD feed | Matching analysis to broker execution |
| Gold Futures | GC or COMEX-related symbols | Exchange-traded gold futures | Futures-specific analysis |
| Gold ETF | GLD or similar | Exchange-traded gold ETF exposure | Equity-market gold exposure |
| Vantage Pro Tip: A gold CFD chart, futures chart, and ETF chart can all reflect gold exposure, but they are not the same instrument. The closer the chart feed is to the execution product, the cleaner the trade planning process ideally becomes. |
Step 4: Add XAU/USD to Your Watchlist
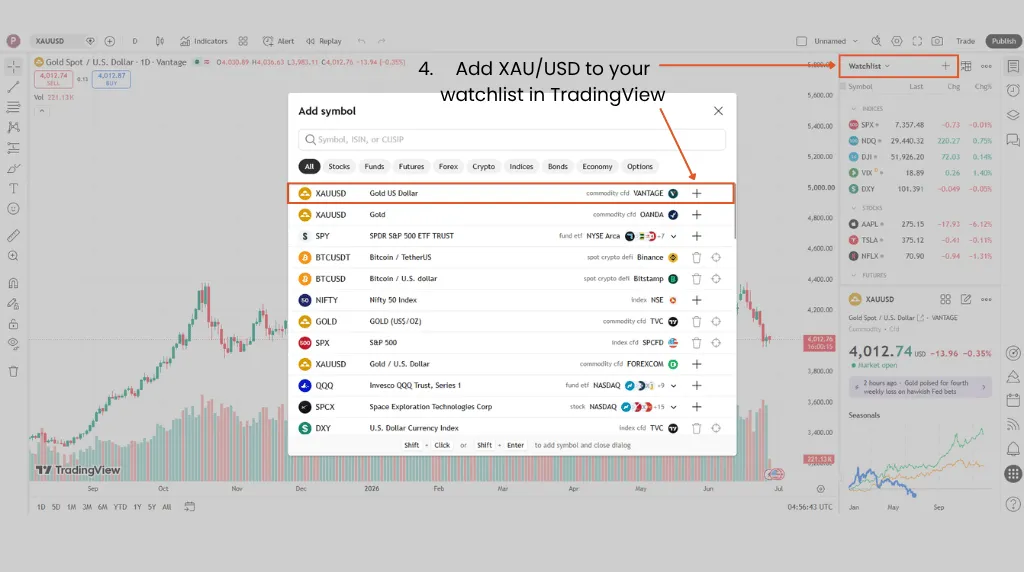
Add your preferred XAU/USD symbol to your TradingView watchlist so you can quickly reopen the same chart feed later. TradingView’s watchlist tools allow users to add and organise symbols from the right-side watchlist panel.2
For gold, a useful curated watchlist may sit beside the US Dollar Index, silver, crude oil, major indices, and Treasury-yield proxies. Always remember that a TradingView watchlist helps with monitoring markets, but it does not constitute a trade plan.
Step 5: Save Your Gold Chart Layout
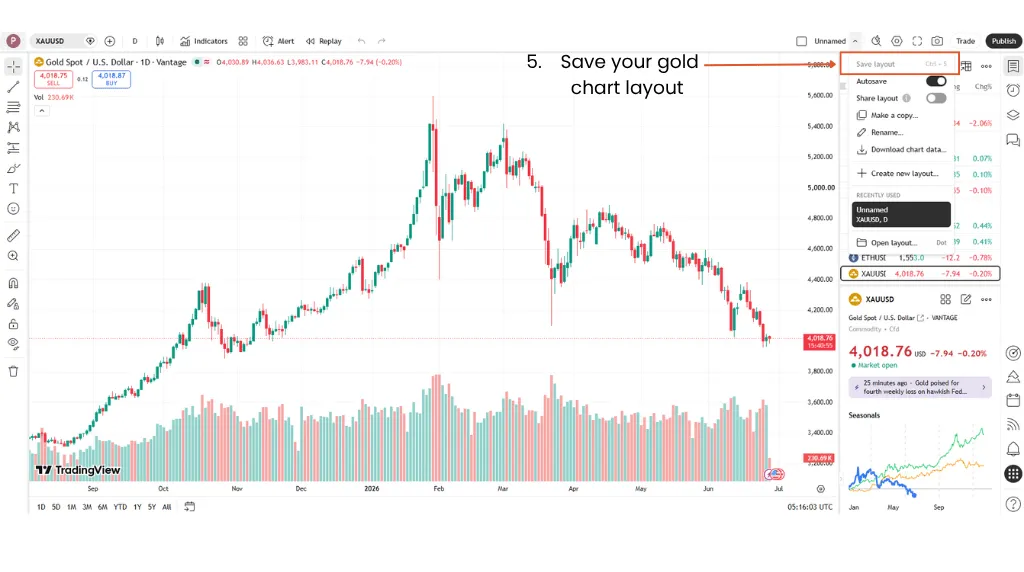
Save the layout after choosing your preferred XAU/USD feed, chart type, timeframe, indicators, and drawing tools. Consistent layouts can help reduce platform friction, especially when gold starts moving quickly.
This matters most if you analyse gold across multiple timeframes. A saved layout keeps the workflow repeatable, so you don’t have to rebuild the chart during active market conditions.
In the next section, we will list out the steps usually taken to analyse a gold chart in TradingView.
Reading The Gold TradingView Chart
A practical gold TradingView setup built for active market monitoring is layered:
- Confirm the symbol first.
- Next, read the timeframe, price structure, session context, and macro risk.
- Then, add the relevant indicators.
Gold can react to central bank policy, geopolitical developments, inflation data, US dollar moves, and shifts in demand. Vantage Markets’ XAU/USD trading strategy guide highlights those drivers as part of the market backdrop traders assess before forming a view.
Step 6: Choose The Right Chart Timeframe
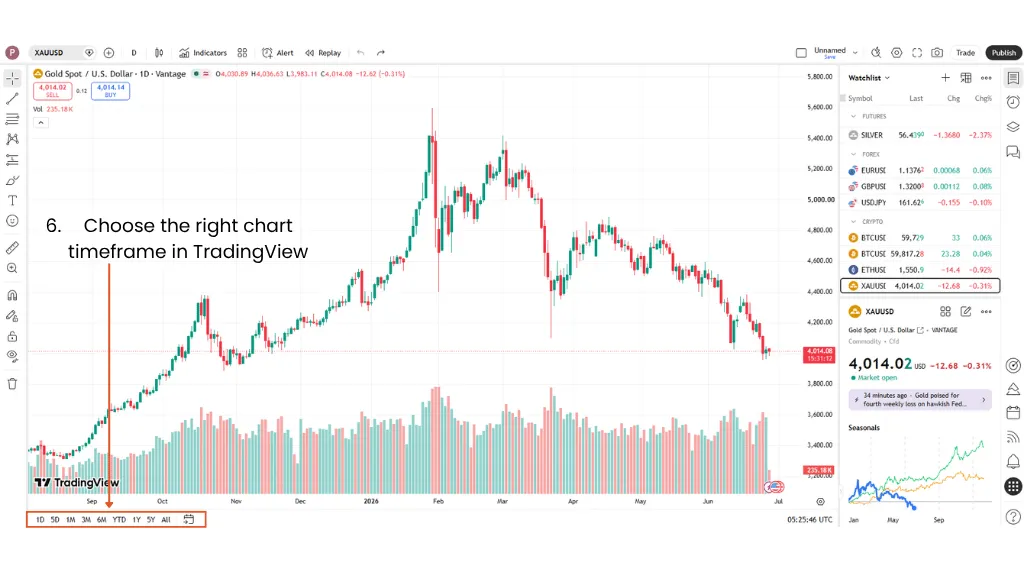
Did you know there’s actually no universally best timeframe for XAU/USD? The right one depends on the holding period, the setup type, and how much intraday noise the trader can tolerate.
Commonly Used XAU/USD Timeframes On TradingView
| Timeframe | Practical Use | Main Risk |
| Daily | Broader trend and major levels | Too slow for intraday execution |
| 4-Hour | Swing structure and trend continuation | Can miss fast intraday reversals |
| 1-Hour | Intraday direction and pullback zones | Still vulnerable to news spikes |
| 15-Minute | Short-term setups and entry refinement | More false breaks and noise |
| 5-Minute | Fast execution and short-term entry analysis | Higher noise and faster stop-outs |
Vantage Markets also offers XAUUSD247, a 24/7 gold CFD product that allows market participation outside standard XAU/USD trading hours. It’s separate from its standard XAU/USD (also offered via CFD), so traders should check the product specifications, funding rate, spread, and margin requirements before trading.
Step 7: Switch to Candlesticks
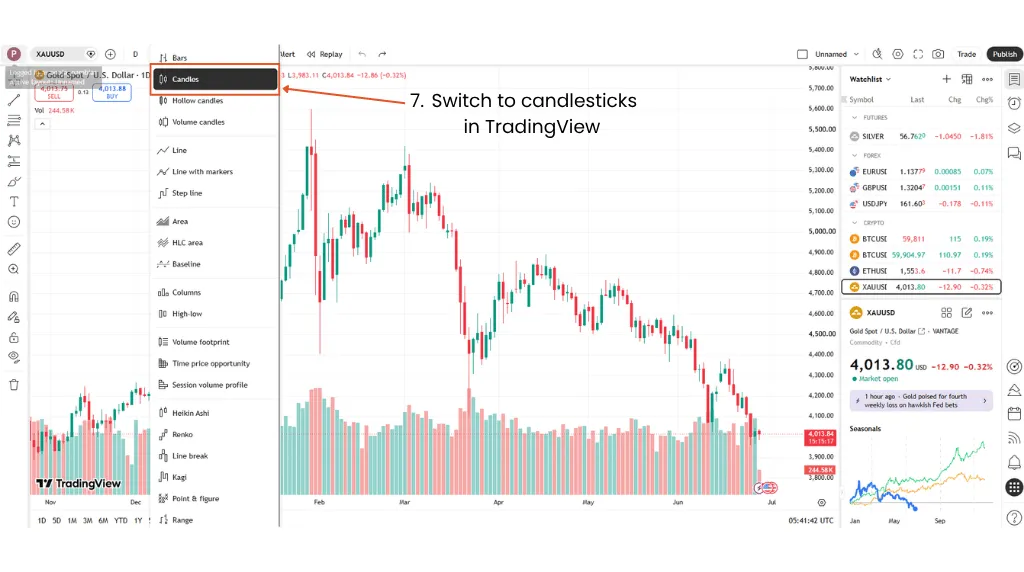
Use candlesticks for trade planning because they show the open, the high, the low, and the close. A line chart can hide the wick that moved through a stop-loss level before price moved back.
That wick behaviour matters in XAU/USD. Gold often tests obvious levels, rejects quickly, and then either continues or snaps back into the prior range.
Step 8: Mark Support, Resistance, And Trendlines
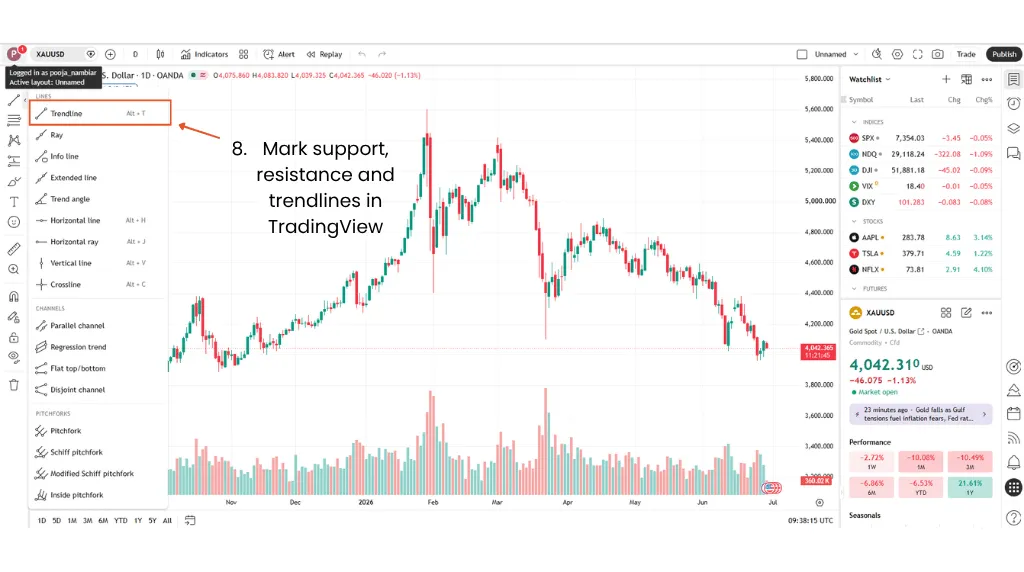
Mark the clearest swing highs, swing lows, rejected zones, and breakout levels first. Avoid turning the chart into a fence of lines.
Levels work better as zones than exact points. If price keeps chopping through a line, the market is telling traders that the level is likely not clean enough for precise execution.
Step 9: Check News And Session Context
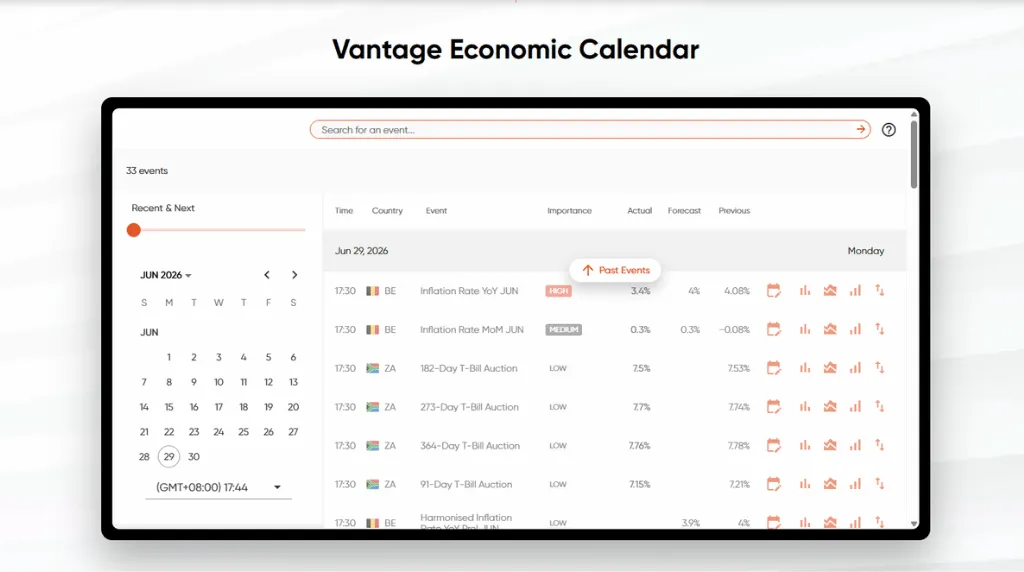
A clean technical setup can fail quickly when high-impact data hits the tape. Vantage Markets’ gold news-trading guide noted that CPI, Non-Farm Payrolls, and central bank decisions can move XAU/USD by shifting expectations around interest rates, yields, and the US dollar.
Before execution, check the Vantage Economic Calendar for scheduled releases that could affect gold. The chart may show a valid level, but a major data release can change liquidity, spreads, and fill quality within seconds.
For eligible clients, Vantage’s TradingView integration also allows a Vantage account to be connected to TradingView, bringing chart analysis and execution closer together. Take note that this integration does not remove execution risk, so the economic calendar check should still happen before opening the order ticket.
In the next section, we’ll share some of the most popular TradingView indicators that are widely used for gold chart analysis.
What Are the Best TradingView Indicators For Gold?
Indicators are filters, not standalone trade signals. Gold can trend hard, reverse quickly, and spike around macro events, so indicator stacking can create false certainty.
TradingView’s Technical Ratings indicator combines inputs from moving averages and oscillators across multiple conditions. This shows how broad technical scoring can be, but the practical takeaway remains clear: No combined rating can replace trade context and risk control.3
Practical TradingView Indicators For Gold
| Indicator | What It Helps With | How Gold Traders Commonly Use It | Main Risk |
| Moving Average | Trend direction | Checks whether price is above or below a key average | Lags during reversals |
| RSI | Momentum and exhaustion | Flags stretched momentum or divergence | Can stay extreme during strong trends |
| MACD | Momentum shifts | Tracks changes in trend momentum | Can react late in fast moves |
| ATR | Volatility | Estimates recent price range and stop distance | Does not predict direction |
| Volume Where Available | Participation context | Adds context to breakout attempts | Spot gold volume may vary by feed |
Moving Averages On XAU/USD
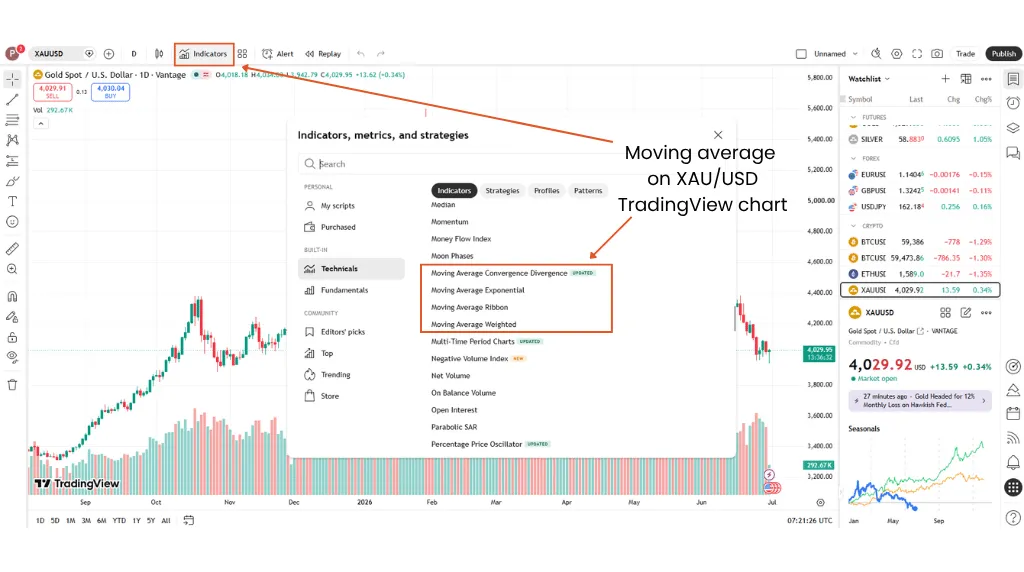
Moving averages help to define trend bias. If gold price is holding above a rising average, the trend may still have structure; repeated closes below it might mean that the momentum is fading.
Never treat a moving-average crossover as a standalone entry. It needs price structure, timeframe alignment, and a risk plan before considering an open position.
RSI Settings For Gold
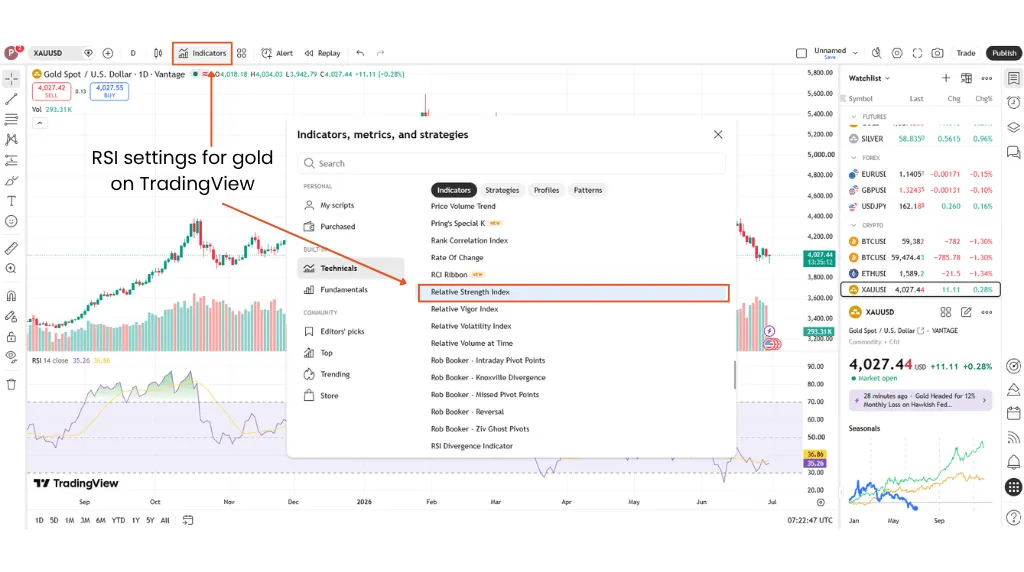
The Relative Strength Index (RSI) is a momentum oscillator that measures the speed and magnitude of directional price moves, according to TradingView’s own indicator documentation.4
For gold, RSI can flag stretched momentum or divergence. The mistake is assuming overbought means ‘sell’ or oversold means ‘buy’; strong trends can keep RSI extended far longer than expected.
MACD And ATR For Gold Volatility
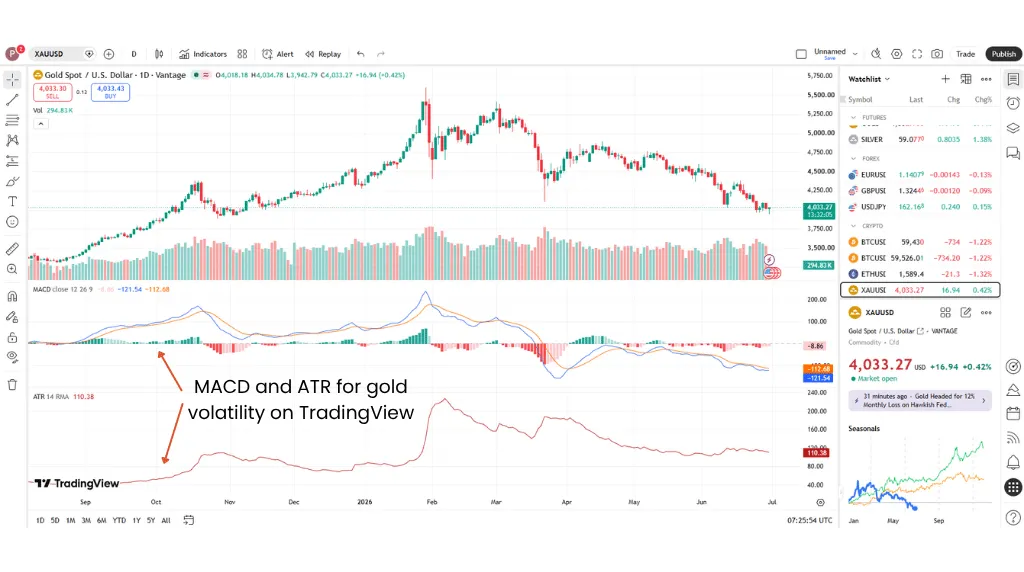
Moving Average Convergence Divergence (MACD) measures the difference between two moving averages and provides a view of momentum and short-term trend behaviour.5
Average True Range (ATR) is more useful for volatility planning than identifying trend direction. It can help frame recent range size, but it does not indicate whether a trader should long or short gold.
| Vantage Pro Tip: More complete gold setups usually combine price structure, timeframe context, and risk control. No TradingView indicator entirely removes the risk of a bad fill, false breakout, or fast reversal. |
In the next section, you’ll learn how to set gold price alerts in TradingView.
How to Set Price Alert on TradingView For Gold
Alerts make TradingView useful beyond passive chart watching. Instead of staring at XAU/USD all day, traders can mark the level that matters and wait for the platform to notify them.
According to TradingView, alerts can be created on data series, indicator plots, strategy orders, and drawing objects. The platform also note that indicator, strategy, and drawing alerts depend on the chart interval used in the calculation.6
Step 10: Set A Gold Price Alert
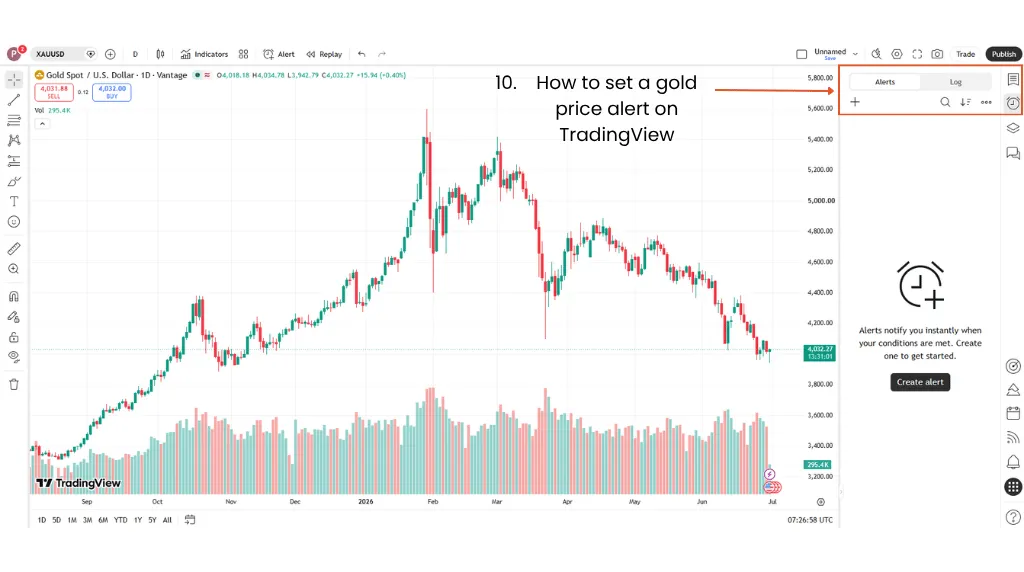
Here’s how to set a gold price alert on TradingView:
- Open the XAU/USD chart
- Right-click near the target price
- Choose “Add Alert”
- Select the condition
- Add a message
- Choose the notification method
- Save the alert
The message field matters. For example, if an alert fires during a fast move, “gold break level” is potentially less useful than “XAU/USD retest of daily resistance; check spread and news risk before order ticket”.
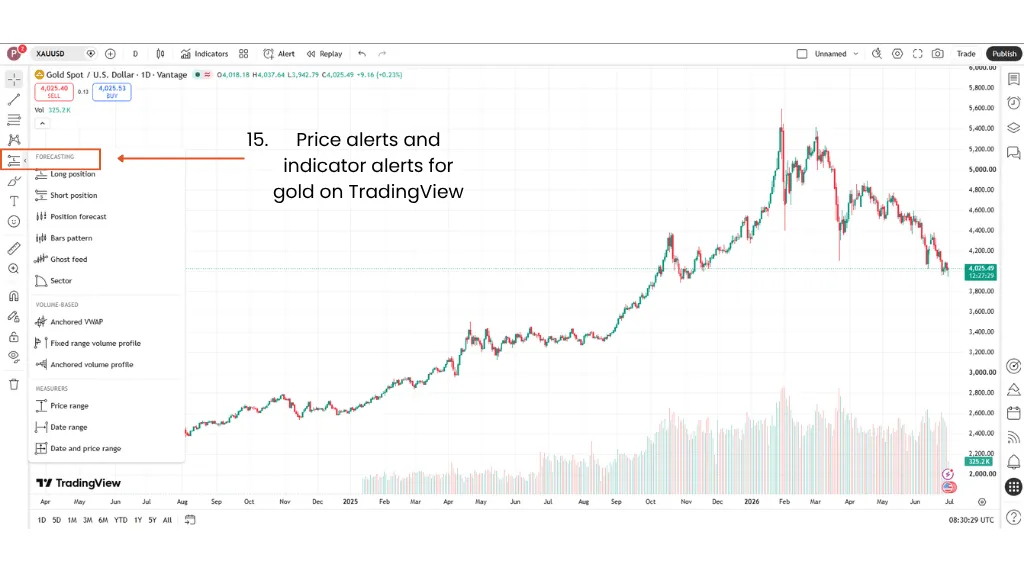
Step 11: Use Price Alerts And Indicator Alerts Differently
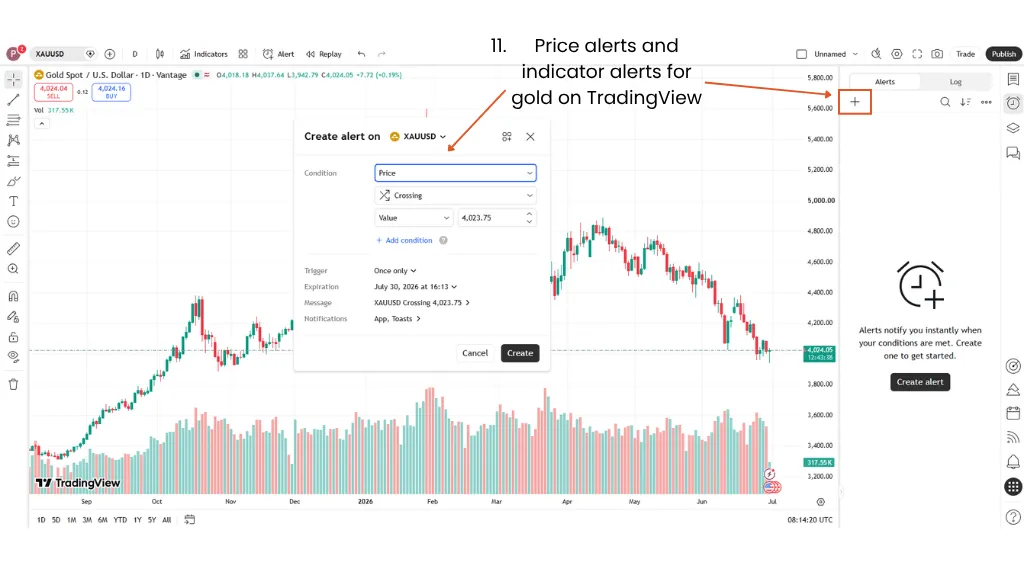
Price alerts and indicator alerts solve different problems. A price alert tells you that XAU/USD has reached a level while an indicator alert tells you that a technical condition has been met.
TradingView Alert Types For Gold
| Alert Type | What It Tracks | Best Use |
| Price Alert | A specific XAU/USD price condition | Support, resistance, breakout, or pullback areas |
| Indicator Alert | A technical indicator condition | RSI levels, moving average crosses, or MACD shifts |
| Drawing Alert | A chart drawing or trendline | Trendline breaks or zone retests |
Step 12: Review Alerts Before Important Market Events
Review alerts before US CPI, Non-Farm Payrolls, Federal Reserve decisions, and other high-impact events. An alert tells you price has reached a level but it does not necessarily confirm the setup is still valid.
If the alert was created using an indicator, recheck the settings after changing the indicator. If an indicator parameter changes after an alert is created, the alert may still use the old settings.
How to Trade Gold on TradingView Using
A common misconception is that TradingView is a brokerage platform—it is not. It simply provides charting, alerts, Paper Trading, and broker-connection tools; the order itself is placed through a supported connected broker platform like Vantage Markets.
In the next few steps, we’ll show how TradingView analysis can connect to gold CFD execution by linking an eligible Vantage Account to a TradingView account and trading directly from TradingView charts where supported.
Step 13: Connect TradingView to a Vantage Account
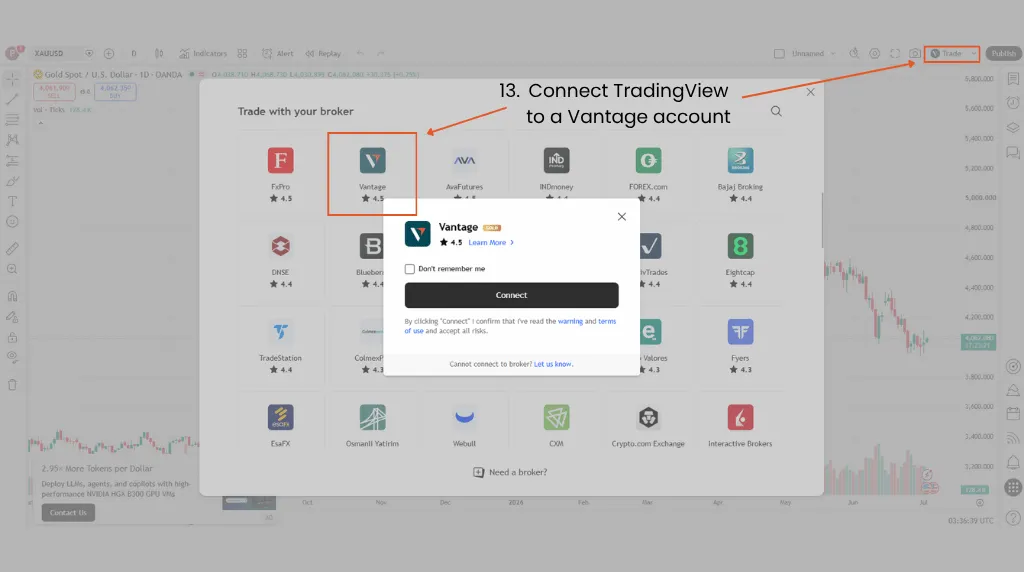
Where available, Vantage clients can use the TradingView integration to connect eligible accounts. Here’s how to get started:
- Create a new account in TradingView and log in.
- On the TradingView platform, search for Vantage Markets under the Brokers tab.
- Next, click on “Open Account” under Vantage Markets as the broker to create your Vantage Live Account.
- Then, click “Connect” to activate the Vantage-TradingView integration.
If the integration is not available in your region or account setup, the TradingView chart can still support analysis while execution happens through another Vantage platform like the Vantage App.
Step 14 — Connect TradingView Analysis To A Vantage Account
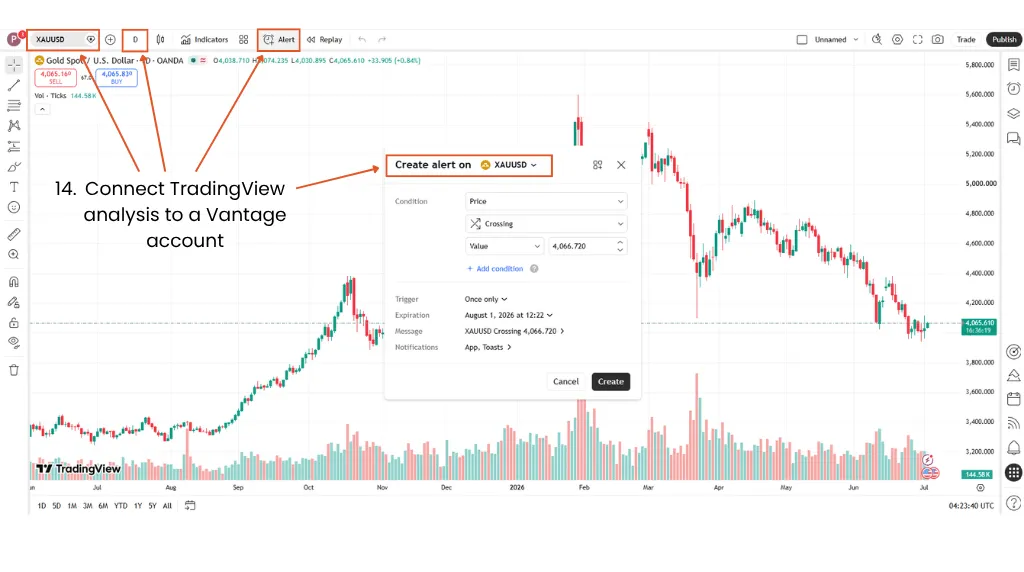
Before opening the ticket, confirm the selected XAU/USD feed, timeframe, setup trigger, invalidation level, and news risk. This is where chart analysis becomes a defined execution plan.
If the alert has fired and price has already moved away from the planned level, reassess the setup before opening the order ticket. The original entry may no longer offer the same spread, risk, or price structure.
Step 15 — Check Position Size, Spread, And Leverage
A gold setup is incomplete without the order-ticket checks, namely:
- Position size,
- Spread,
- Stop-loss distance,
- Take-profit level,
- Margin, and
- Leverage (Take note that leverage is a double-edged sword because it magnifies favourable and unfavourable price moves.)
For deeper rules on sizing and risk control, Vantage Markets’ XAU/USD risk management guide covers position sizing, margin, and leverage considerations specifically for gold traders.
Step 16 — Practise The Workflow In Demo First
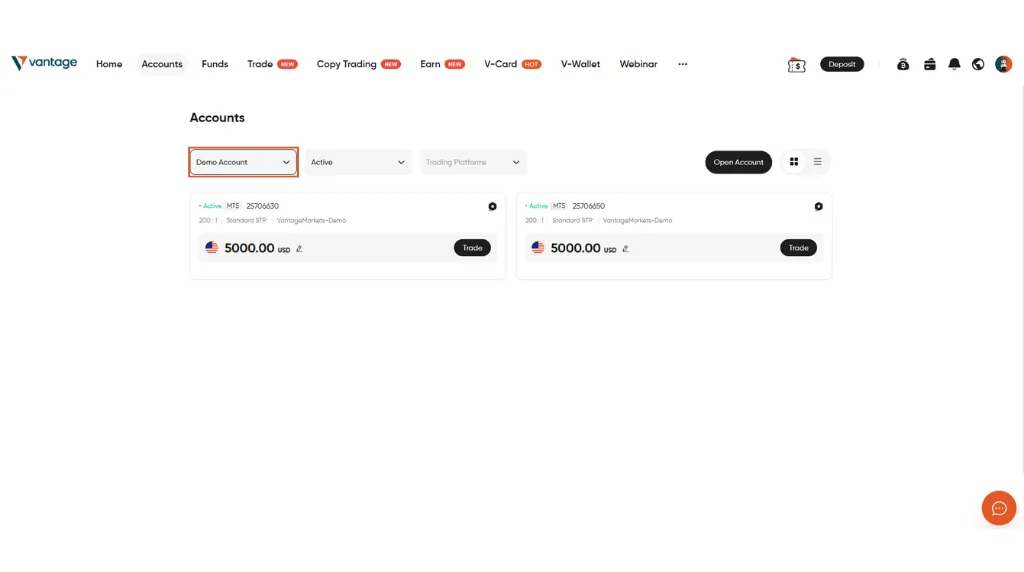
Demo trading with Vantage Markets or paper trading on TradingView can help test the workflow before live execution. These practice environments are useful for checking symbol selection, alerts, order entry, and trade management under simulated conditions.
Note: Live trading involves real spreads, possible slippage, changing liquidity, and emotional pressure. Treat demo results as practice, not proof.
From TradingView Analysis to Gold CFD Execution With Vantage Markets
| Step | On TradingView’s Platform | Execution Check |
| Connect Account | Connect an eligible Vantage account through TradingView where available | Confirm product access, region availability, and account setup |
| Find Setup | Mark trend, support, resistance, and trigger levels | Confirm the idea still fits market conditions |
| Check Risk | Estimate invalidation level and stop-loss distance | Set position size before opening the order ticket |
| Set Alert | Create a price or indicator alert | Reassess the setup if price moves away from the planned level |
| Open Ticket | Use Vantage’s TradingView integration or another Vantage platform | Check spread, margin, and order type |
| Manage Trade | Monitor chart, alerts, and order status | Review against the predefined plan |
Turn Gold Chart Analysis Into A Defined Trade Plan
The point of a gold TradingView workflow is not to add more indicators; it’s to reduce ambiguity before price starts moving.
Choose the correct XAU/USD symbol, read the chart structure, define the level, set the alert, check the order ticket, and only then, move from analysis to execution. Where available, Vantage’s TradingView integration lets eligible clients connect their Vantage account to TradingView and trade directly from the charts.
To put this workflow into practice, eligible clients can connect a Vantage Account to TradingView where supported, or use a Demo Account to practise the workflow before deciding whether live trading is appropriate for their circumstances.
Related Article: A Beginner’s Guide to TradingView
Frequently Asked Questions (FAQs)
How Do I Add Gold to TradingView?
Search for XAU/USD or XAUUSD in Symbol Search, choose the relevant data source, open the chart, and add it to your watchlist. Only typing ‘gold’ may show futures, ETFs, broker feeds, and other related instruments. For CFD analysis, the selected chart should match the product you plan to execute as closely as possible.
What Is the Gold Symbol on TradingView?
XAU/USD is the common ticker symbol for spot gold priced in US dollars. TradingView may display it as XAUUSD, depending on the feed. Broker feeds, futures symbols, and ETF symbols may differ, so always check the instrument description before building the setup.
How Do I Set Up XAU/USD on TradingView?
Select the XAU/USD chart, choose a timeframe, switch to candlesticks, mark major support and resistance zones, add your preferred indicators, and save the layout. The cleaner workflow is symbol first, structure second, indicator last. This avoids building a crowded chart before the trade idea is clear.
Is TradingView Good For Gold Trading?
TradingView is widely used for gold charting, alerts, drawing tools, and technical analysis. That said, the platform is still only one part of the workflow. Execution quality, spreads, leverage, position sizing, and risk management remain separate decisions.
What Is the Best Indicator For Gold on TradingView?
There is no single best TradingView indicator for gold. Moving averages can help identify trend bias, RSI can highlight momentum conditions, MACD can track momentum shifts, and ATR can frame recent volatility.
Each indicator answers a different question. None can confirm a trade on its own, and none removes the risk of false breakouts, fast reversals, wider spreads, or poor execution.
Can I Trade Gold Directly From TradingView?
Yes, only where a supported broker integration is available. TradingView provides the charting interface and broker connection layer, while execution happens through the connected broker account. Vantage clients in eligible regions may connect their Vantage and TradingView accounts where the integration is available.
Can I Paper Trade Gold on TradingView?
Yes, TradingView’s paper trading tools can help you practise gold setups in risk-free conditions. Bear in mind that simulated execution is not the same as live trading because live markets involve spreads, slippage, liquidity changes, and emotional pressure. Treat it as workflow practice, not a guarantee of how your real capital would perform in live markets.
RISK WARNING: CFDs are complex financial instruments and carry a high risk of losing money rapidly due to leverage. You should ensure you fully understand the risks involved and carefully consider whether you can afford to take the high risk of losing your money before trading.
Disclaimer: The information is provided for educational purposes only and doesn’t take into account your personal objectives, financial circumstances, or needs. It does not constitute investment advice. We encourage you to seek independent advice if necessary. The information has not been prepared in accordance with legal requirements designed to promote the independence of investment research. No representation or warranty is given as to the accuracy or completeness of any information contained within. This material may contain historical or past performance figures and should not be relied on. Furthermore estimates, forward-looking statements, and forecasts cannot be guaranteed. The information on this site and the products and services offered are not intended for distribution to any person in any country or jurisdiction where such distribution or use would be contrary to local law or regulation.
References
1. “How to trade on TradingView — TradingView”. https://www.tradingview.com/support/solutions/43000756695-how-to-trade-on-tradingview/. Accessed on 28 June 2026.
2. “Mastering the TradingView Watchlists — TradingView”. https://www.tradingview.com/support/solutions/43000745825-mastering-the-tradingview-watchlists/. Accessed on 28 June 2026.
3. “Technical Ratings — TradingView”. https://www.tradingview.com/support/solutions/43000614331-technical-ratings/. Accessed on 28 June 2026.
4. “Relative Strength Index (RSI) — TradingView”. https://www.tradingview.com/support/solutions/43000502338-relative-strength-index-rsi/. Accessed on 28 June 2026.
5. “Moving Average Convergence Divergence (MACD) Indicator — TradingView”. https://www.tradingview.com/support/solutions/43000502344-moving-average-convergence-divergence-macd-indicator/. Accessed on 28 June 2026.
6. “How to set up Alerts — TradingView”. https://www.tradingview.com/support/solutions/43000595315-how-to-set-up-alerts/. Accessed on 28 June 2026.