
Liquidity is how quickly and at what cost an asset can be converted to cash without meaningfully affecting its price. It shapes everything from the spread in forex trading to whether a business can meet payroll this week.
Liquid markets move money efficiently. Illiquid ones impose costs on every transaction—through wider spreads, slower execution, or the risk that a position cannot be closed at a fair price when it matters most.
This article covers what liquidity means across finance and trading, the types that matter most, how each is measured, and what liquidity risk looks like in practice.
Key Points
- Liquidity measures how quickly an asset can be converted to cash without a significant price change—cash is the most liquid asset; real estate and collectables sit at the illiquid end of the spectrum.
- In trading markets, high liquidity is visible as tight bid-ask spreads, high volume, and fast order execution—most clearly seen in major forex CFD pairs such as EUR/USD.
- Liquidity risk—the possibility that a position cannot be exited at a fair price—is a key consideration when trading CFDs on volatile or thinly traded instruments.
What Is Liquidity?
In plain terms, liquidity tells you how quickly you can sell something without accepting a worse price for it. The easier it is to exit at or near the current market price, the more liquid the asset.
Cash is the reference point—the most liquid asset, immediately usable at its stated value without any conversion. From there, liquidity falls across a spectrum. Government bonds and major-index stocks can typically be converted within one to two business days. Gold and crude oil are highly liquid in futures form but less so as physical assets. At the far end, real estate and private equity may take weeks, months, or years to sell at fair value.
For traders, this spectrum has direct practical consequences. When you take a position in a major forex CFD, you are operating in one of the deepest markets in the world—the gap between your entry price and the quoted spread is narrow, and exiting the position quickly is straightforward. The same is not true of a thinly traded small-cap stock or an exotic currency pair, where the cost of entry and exit is higher and execution is less predictable.
Liquidity in Finance vs Liquidity in Business
In financial markets, liquidity measures how easily assets can be traded without affecting market prices. A highly liquid market—such as those for major forex pairs or large-cap stock indices—enables large trades to pass through smoothly with minimal price impact.
In business, liquidity describes a company’s capacity to meet short-term financial obligations using assets that can be converted to cash quickly. A firm with strong cash holdings and receivables is highly liquid; one whose assets are largely fixed—machinery, property, long-term contracts—may be technically solvent but cash-poor in practice.
Liquidity vs Solvency vs Cash Flow
These three concepts often appear together but describe different financial conditions:
- Liquidity — whether assets can be quickly converted to meet immediate obligations.
- Solvency — whether total assets exceed total liabilities over the long term.
- Cash flow — the actual movement of money into and out of a business over a given period.
A company can be solvent yet illiquid: its assets exceed its debts, but most are tied up in property or equipment that cannot be sold quickly. Conversely, strong monthly cash flow does not guarantee solvency if accumulated liabilities outweigh total assets. Each measure reveals a different dimension of financial health.
Types of Liquidity
Liquidity takes different forms depending on whether the context is a financial market, a corporate balance sheet, or a banking institution. Each type operates on different timescales and reveals a distinct dimension of financial health—together they give a complete picture of how liquid a market or organisation actually is.
Market Liquidity
Market liquidity describes how quickly assets can be bought or sold without causing significant price movement. A market is considered highly liquid when many active participants are present on both sides, keeping the gap between buying and selling prices narrow.
The forex market is the clearest example. The Bank for International Settlements (BIS) 2025 Triennial Survey recorded average daily FX turnover at $9.6 trillion—a depth that means even large institutional orders pass through major pairs with minimal price impact [1].
Stock index CFDs on the S&P 500, FTSE 100, and DAX carry similarly high liquidity. Markets become illiquid when participation falls: during off-hours sessions, on thinly traded instruments, or when uncertainty drives participants to reduce exposure.
Accounting Liquidity
Accounting liquidity—also called corporate liquidity—measures a company’s ability to cover its short-term obligations using available assets. It is assessed through specific financial ratios rather than market behaviour.
Strong accounting liquidity signals disciplined financial management. Weak accounting liquidity suggests a company may struggle to meet payroll, service short-term debt, or absorb unexpected costs—even if it appears profitable on paper.
Funding Liquidity
Funding liquidity refers to how easily financial institutions can access cash to meet their obligations. For banks, this comes through customer deposits, interbank lending, or central bank facilities.
Funding liquidity becomes critical during financial stress. When institutions doubt each other’s solvency, interbank lending can seize up rapidly, draining liquidity across the system. The 2007–2008 financial crisis demonstrated this: banks that appeared solvent found themselves unable to fund short-term obligations when wholesale funding markets closed.
Operational and Contingent Liquidity
Operational liquidity ensures that routine payments—payroll, settlements, supplier invoices—can be met without disruption. Contingent liquidity refers to emergency facilities and credit lines available when unexpected shocks arise.
Together, these forms make clear that liquidity is not simply cash on hand. It also reflects resilience: the capacity to keep operating under financial stress.
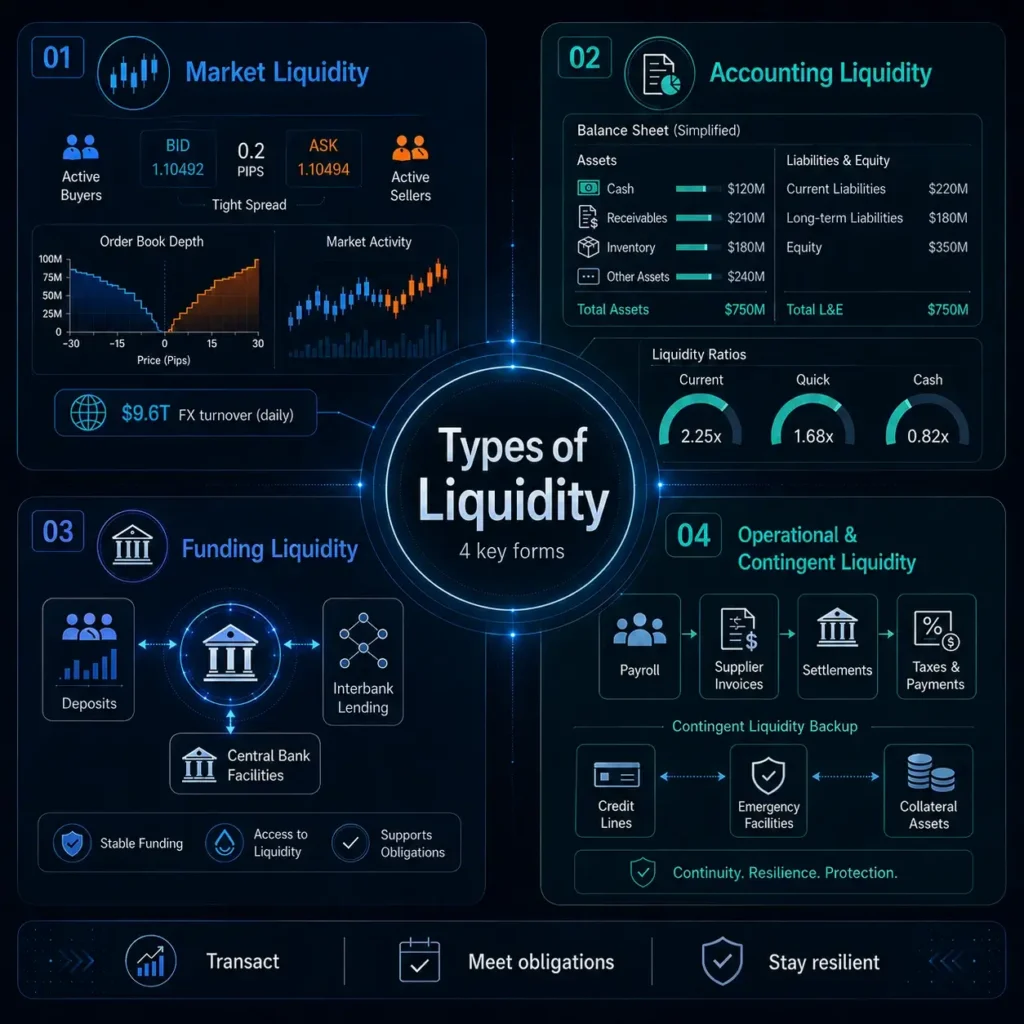
Image 1: The four main types of liquidity
Liquid and Illiquid Assets
The table below ranks common asset classes from most to least liquid under typical market conditions. The order may shift during periods of stress.
| Asset | Indicative Liquidity Profile | Notes |
| Cash | Generally highly accessible | Usually available at its stated value without requiring conversion into another asset, subject to account and currency restrictions. |
| Major forex CFDs (EUR/USD, USD/JPY) | Generally high | Major currency pairs typically have broad market participation, although liquidity and spreads may vary across trading sessions and during periods of volatility. |
| Short-term government bonds | Generally high | Widely traded sovereign bonds can often be sold through secondary markets, although liquidity depends on the issuer, maturity, and market conditions. |
| Large-cap equity CFDs (S&P 500, FTSE 100) | Generally high | Liquidity is supported by actively traded underlying shares and indices, but execution conditions may vary outside core market hours or during volatile periods. |
| Commodity CFDs (gold, crude oil) | Generally high | Pricing is supported by active underlying spot and futures markets, although liquidity may change around market events, contract rollovers, or reduced trading hours. |
| Corporate bonds | Variable | Liquidity depends on factors including the issuer’s credit quality, bond size, maturity, and secondary-market activity. |
| Small-cap stocks | Generally lower | Lower trading volumes and shallower order books may result in wider spreads and greater price movement from individual orders. |
| Real estate | Limited | Transactions may take several weeks or months to complete and depend on valuation, buyer demand, financing, and market conditions. |
| Private equity | Highly limited | Investments are generally not traded on public markets and may require a specific buyer or a defined exit event. |
| Art and collectables | Highly limited and transaction-dependent | Sales generally rely on specialist buyers, auctions, or private transactions, and market value may be difficult to determine quickly. |
Table 1: Illustrative liquidity ranking of common asset classes. Actual liquidity varies with market conditions.
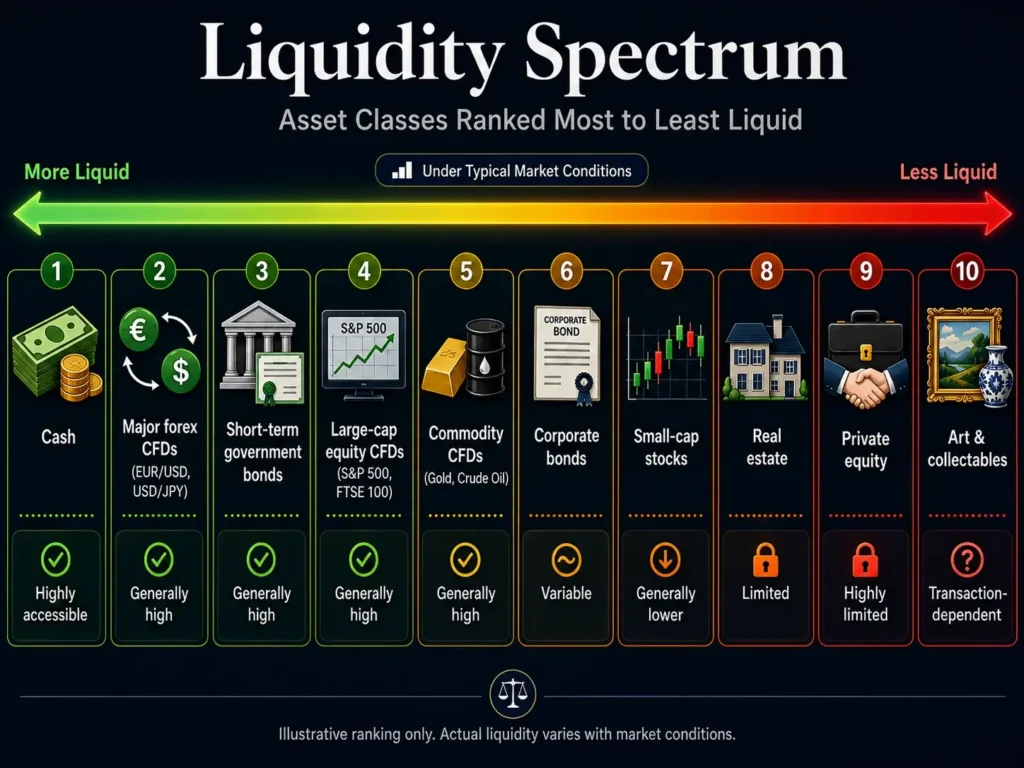
Image 2: Liquidity Spectrum — Asset Classes Ranked Most to Least Liquid
How Liquidity Is Measured
Liquidity can be assessed in two distinct ways depending on the context. For companies, financial ratios compare current assets against short-term obligations to show how comfortably near-term debts can be covered.
In trading markets, the focus shifts to observable signals—spreads, volumes, and order book depth—that reflect how efficiently transactions are flowing in real time.
Accounting Ratios
Three financial ratios are used to assess corporate liquidity, each progressively more conservative:
- Current ratio — current assets divided by current liabilities. A ratio above 1.0 means the company can cover its short-term obligations; below 1.0 indicates a potential shortfall.
- Quick ratio (acid-test ratio) — the same calculation excluding inventory, focusing only on assets that can be converted to cash quickly. This gives a sharper view of immediate solvency.
- Cash ratio — the most conservative test, comparing only cash and cash equivalents to current liabilities. It answers whether the company could cover short-term debt with cash alone.
Each ratio answers a slightly different question. Used together, they give a layered picture of how well-positioned a company is to handle near-term financial pressure.
Market Indicators of Liquidity
In trading, three primary signals reflect market liquidity:
- Bid-ask spread — the gap between the highest price a buyer will pay and the lowest a seller will accept. Narrow spreads indicate strong liquidity; wider spreads signal lower activity or elevated uncertainty. On highly liquid instruments such as EUR/USD forex CFDs, spreads can be as tight as fractions of a pip.
- Trading volume — The total number of contracts, shares, or lots exchanged within a given period. Higher volume generally indicates broader market participation and may make it easier to enter or exit a position near the quoted price.
- Market depth — the volume of standing buy and sell orders at different price levels. A deep market can absorb large orders without significant price movement; a shallow one cannot.
Liquidity Across Trading Markets
Liquidity is not uniform across all markets or instruments. The depth available in forex, equities, and commodities each follows its own pattern, shaped by the number of active participants, trading hours, and the nature of the underlying asset.
For CFD traders, these differences flow through directly into the spreads, execution quality, and slippage risk attached to every position.
Liquidity in Forex
The forex market is the most liquid financial market globally, operating continuously across time zones with participation from central banks, commercial banks, hedge funds, corporations, and retail traders. The BIS 2025 Triennial Survey recorded average daily FX turnover at $9.6 trillion—a depth that makes even large orders largely invisible to market prices in the major pairs.1
The most widely traded currency pairs—including EUR/USD, GBP/USD, and USD/JPY—typically attract broad market participation, which can support tighter spreads and more consistent execution under normal market conditions.
Liquidity often peaks during major forex trading-session overlaps, particularly when the London and New York sessions are both active. Activity may be lower during quieter periods, which can affect spreads and execution conditions.
Emerging market and exotic pairs carry significantly less liquidity. Spreads are wider, order books are thinner, and individual trades carry more price impact—all of which flows through to the execution quality available on CFDs referencing those pairs.
Liquidity in Stocks
Liquidity differs between index and stock trading, as individual shares depend on company-specific trading activity, while indices reflect the combined activity of their underlying constituents.
Large-cap shares on major exchanges—including FTSE 100, S&P 500, and DAX constituents—generally attract broader institutional and retail participation, which can support narrower spreads and more consistent execution under normal conditions.
Smaller-cap and thinly traded stocks present a different picture. Order books are shallow, spreads are wider, and modest order sizes can move the price noticeably. For traders using equity CFDs, this underlying liquidity flows directly into execution quality: a position that is easy to open may be difficult to close at a comparable price in a less liquid stock.
Liquidity in Commodities and Other Assets
Benchmark commodities—gold and crude oil—are among the world’s most liquid tradeable assets, supported by deep futures markets that form the pricing reference for CFDs. A trader taking a position in a gold CFD may gain exposure to price movements linked to underlying gold markets, with pricing and execution conditions depending on the broker’s model and market conditions.
At the other end, physical commodities, real estate, private equity, and collectables are illiquid by nature. They cannot be converted to cash quickly without accepting material price concessions—the cost of their illiquidity.
What Affects Liquidity?
Liquidity is not fixed—several forces cause it to expand or contract, sometimes rapidly:
- Market conditions and events — Financial stability supports activity and keeps liquidity healthy. Recessions, sharp rate changes, and geopolitical shocks drive participants to hold cash, contracting liquidity quickly. During the 2007–2008 financial crisis, credit market liquidity disappeared in days as counterparty confidence collapsed.
- Investor sentiment — Bullish markets attract participation; bearish or uncertain conditions reduce it. Fear-driven withdrawals can become self-reinforcing: as liquidity falls, execution deteriorates, encouraging further withdrawal.
- Regulation and market structure — Capital requirements, transaction taxes, and circuit breakers all affect how freely markets operate. Improvements in electronic trading infrastructure generally increase liquidity by reducing the friction of price discovery.
- Time of Day and Seasonality — Forex liquidity often peaks during major forex trading-session overlaps, while activity may fall during quieter periods. Equity markets are generally most active near the open and close, and year-end periods may bring lower trading volumes as institutions adjust their exposure ahead of reporting dates.
Liquidity Risk for Traders
Liquidity risk is the possibility that a position cannot be exited at a fair price—either because there are insufficient counterparties, or because the act of executing the order moves the market significantly against the trader.
It shows up in several practical ways:
- Slippage — An order may be filled at a different price from the one quoted when it was submitted, particularly during fast-moving or lower-liquidity market conditions.
- Wider spreads — the bid-ask gap expands during low-liquidity periods, increasing the implicit cost of entering and exiting.
- Partial fills — a large order cannot be completed at one price level, resulting in an average entry price worse than expected.
- Gap risk — the price reopens significantly above or below the prior close, bypassing standing stop orders entirely.
Limit orders can provide greater control over the price at which an order is executed. However, the order may remain unfilled if the market does not reach the specified price or if sufficient liquidity is unavailable at that level.
CFD traders may encounter greater liquidity risk during major news releases, quieter trading sessions, and when accessing instruments with fewer active market participants. These considerations can form part of a broader risk management approach, alongside position sizing, market selection, and an understanding of how different orders may behave during volatile conditions.
Stop-loss orders do not guarantee execution at the set level in fast-moving markets. Past performance is not a reliable indicator of future results.
Why Liquidity Matters to CFD Traders
Liquidity affects every dimension of how a trade performs—from the moment of entry to the point of exit. The table below summarises how high and low liquidity conditions compare across the key factors traders care about:
| Aspect | High Liquidity | Low Liquidity |
| Trade execution | Fast, close to expected price | Slower; wider range of outcomes |
| Bid-ask spread | Narrow — lower transaction cost | Wide — higher implicit cost per trade |
| Price stability | Stable, predictable movement | Sharp, unpredictable swings |
| Slippage risk | Low | High — particularly during news events |
| Stop-loss reliability | High; fills close to set level | Lower — gap risk more likely |
| Trader confidence | High participation; active markets | Cautious participation; thin order books |
Table 2: Impact of liquidity on key trading conditions. For illustrative purposes.
For traders learning how CFD trading works, the liquidity profile of the underlying market is an important part of assessing potential transaction costs and execution risk. A tight quoted spread in a less active market may widen during fast-moving conditions, while a deeper market may be able to absorb the same order with less price impact.
Putting Liquidity Into Perspective
Liquidity is a practical measure of how easily an asset can be converted into cash without a substantial change in price. It differs across asset classes and can shift with market conditions, trading activity, economic events, and investor sentiment. Understanding these differences helps explain why some assets can be bought or sold quickly, while others may require more time or a price adjustment to complete a transaction.
Whether assessing a company’s ability to meet short-term obligations or evaluating conditions in a financial market, liquidity provides important context for understanding cost, accessibility, and risk. Traders, investors, and businesses should therefore consider liquidity alongside factors such as volatility, market depth, time horizon, and their broader financial objectives.
Frequently Asked Questions (FAQs)
What is liquidity in simple terms?
Liquidity is how quickly and easily you can sell something at a fair price. Cash is the most liquid asset—it can be spent immediately at face value. Shares in a large publicly traded company are fairly liquid, typically convertible to cash within a trading session. A house is illiquid: finding a buyer and completing a sale can take weeks or months, and the final price may not match initial expectations. The more liquid an asset, the less of a discount you typically need to accept in order to sell it quickly.
What is liquidity in forex?
In the foreign exchange market, liquidity describes how easily currency pairs can be bought and sold. Major pairs—EUR/USD, USD/JPY, GBP/USD—are highly liquid because participants from central banks to retail traders transact in them continuously around the clock, keeping bid-ask spreads tight and allowing large orders to pass through with minimal price impact. Retail traders may access forex markets through CFDs, where underlying market conditions can influence spreads and execution quality.
What is liquidity in stocks?
Stock liquidity depends on how actively a company’s shares are traded. Large-cap stocks on major exchanges attract consistent institutional and retail activity, producing tight spreads and reliable execution. Smaller companies and those on less active exchanges are less liquid: order books are thinner, spreads are wider, and individual orders carry more price impact. For traders using equity CFDs, the underlying stock’s liquidity determines the execution quality available when opening and closing positions.
What is liquidity risk?
Liquidity risk is the possibility that a position cannot be closed at a fair price when needed. It manifests as slippage (filling at a worse price than expected), widened spreads during volatile or low-volume sessions, partial fills on larger orders, or gap risk when markets reopen. CFD traders are most exposed during major news events, overnight sessions on thin instruments, or when trading in markets with a naturally small participant pool. It does not disappear in normally liquid markets—it simply becomes less likely to materialise in a significant way.
What is the difference between high and low liquidity?
A highly liquid market has many active buyers and sellers, tight bid-ask spreads, deep order books, and fast, predictable execution. A low-liquidity market has fewer participants, wider spreads, shallower order books, and greater price sensitivity to individual trades. The practical consequence for traders is direct: in a liquid market, entering and exiting positions close to the quoted price is reliable; in an illiquid one, it is not—and the cost of transacting is higher at every step.
Is high or low liquidity better for trading?
High liquidity is generally preferable for active traders, as it means tighter spreads, faster execution, and more predictable pricing. Some longer-horizon investors deliberately seek less liquid assets—private equity, small-cap stocks, specialist commodities—because less efficient pricing may offer return potential unavailable in deeply liquid markets. Whether high or low liquidity is preferable depends on the trader’s strategy, time horizon, and capacity to absorb execution risk.
RISK WARNING: CFDs are complex financial instruments and carry a high risk of losing money rapidly due to leverage. You should ensure you fully understand the risks involved and carefully consider whether you can afford to take the high risk of losing your money before trading.
Disclaimer: The information is provided for educational purposes only and doesn’t take into account your personal objectives, financial circumstances, or needs. It does not constitute investment advice. We encourage you to seek independent advice if necessary. The information has not been prepared in accordance with legal requirements designed to promote the independence of investment research. No representation or warranty is given as to the accuracy or completeness of any information contained within. This material may contain historical or past performance figures and should not be relied on. Furthermore estimates, forward-looking statements, and forecasts cannot be guaranteed. The information on this site and the products and services offered are not intended for distribution to any person in any country or jurisdiction where such distribution or use would be contrary to local law or regulation.
References
- “Triennial Central Bank Survey of foreign exchange and Over-the-counter (OTC) derivatives markets in 2025 – BIS” https://www.bis.org/statistics/rpfx25.htm Accessed 19 June 2026