



 Updated
TradingView offers a vast ecosystem of technical indicators—hundreds of tools designed to cater to traders of every experience level. Whether you are just starting your journey or are a seasoned market participant, adding indicators to TradingView allows you to customise your workspace and sharpen your decision-making process.
In this article, we explore three widely used tools that provide a clearer understanding of price movements and market behaviour. We’ll look at how to master momentum with the TradingView RSI, identify momentum shifts with a TradingView MACD divergence indicator, and use a simple MA indicator on TradingView as a strong trend indicator to stay on the right side of the market.
Key Points
- TradingView offers a wide range of indicators that can help traders analyse market trends and price momentum across different timeframes.
- Using tools like RSI, Moving Averages, and MACD together can improve clarity, reduce false signals, and support better trading decisions.
- Testing indicator combinations in real or demo environments is essential to refining your strategy and aligning tools with your trading style.
The Role of TradingView Indicators in Developing Strategic Trading Strategies
TradingView indicators play a crucial role in shaping effective strategies when applied appropriately. By adding indicators to TradingView and testing them in real market conditions, traders can gain critical insights that refine their decision-making process and improve consistency over time.
Choosing your indicators based on your trading strategy
With a wide range of tools available, it’s important to select those that complement your specific approach. For instance, an intraday trader might rely on a TradingView RSI to spot quick overbought or oversold conditions, while a swing trader might prefer a strong trend indicator on TradingView—like a moving average—to capture larger market moves.
Using different indicators that align with your trading style—short-term or long-term—you can gain insights that may help support your overall trading decisions.
Relative Strength Index (RSI): What It Is and How It Can Support Your Trading Decisions
The TradingView RSI (Relative Strength Index) measures the strength or weakness of any asset by comparing its upward moves versus its downward moves over a specific period. It helps traders identify price momentum, overbought and oversold conditions, as well as potential divergence signals.
When to Use the RSI Indicator in Trading
The RSI is an oscillator that moves between 0 and 100, measuring the speed and velocity of price movements.
- Trend Identification: A reading above 50 typically indicates rising momentum, while a reading below 50 suggests falling momentum.
- Overbought vs. Oversold: The RSI is considered “overbought” when above 70 and “oversold” when below 30. Readings between 30 and 70 are seen as neutral.
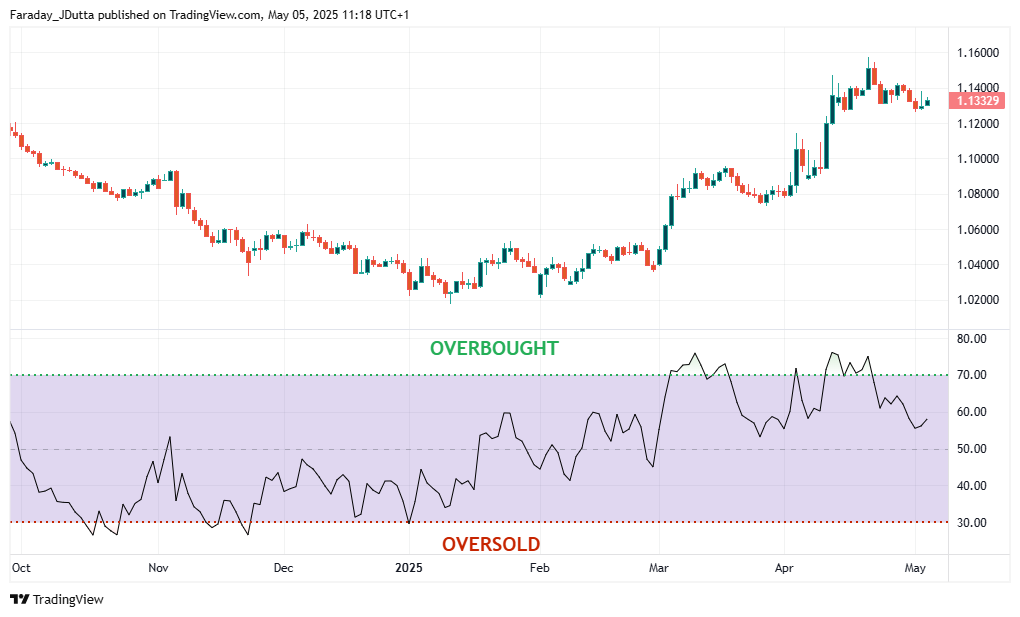
Traders often use the RSI to confirm the strength of a new trend or to spot potential reversals. For example, if the price is making new highs but the RSI is failing to do so, this could be a divergence signal—hinting that the trend is losing steam. It can also highlight when an asset may be entering “overbought” or “oversold” territory, which could suggest potential entry or exit points.
How to Set Up the RSI Indicator on TradingView
Adding indicators to TradingView is simple. To set up the RSI:
- Click the “Indicators” tab at the top of your chart.
- Search for “RSI” or “Relative Strength Index.”
- Select it to add it to your workspace.
Once added, you can customise it by clicking the settings icon to adjust parameters like length, data source, and visual preferences to match your chart style.
Combining This with Other Tools
Using a single technical indicator can be helpful, but combining it with other tools may offer a more comprehensive view of the market. When multiple indicators align to confirm signals, chart patterns, or key price levels, it can strengthen the overall strategy. This approach may help filter out false signals and provide greater confidence when making trading decisions.
Moving Averages (EMA/SMA): What They Are and How to Use Them
Moving averages are among the most commonly used technical tools for determining the future direction of a market. An MA indicator on TradingView calculates the average closing price of an asset (eg. a currency pair) over a specified number of periods. Commonly used timeframes include the 20-day, 50-day, and 200-day moving averages.
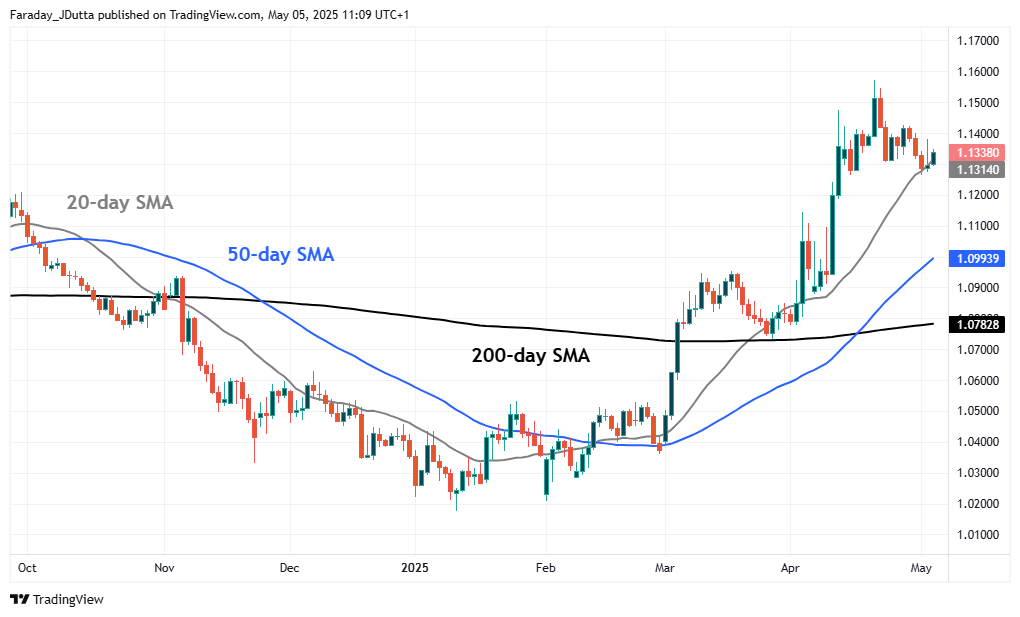
Essentially, moving averages smooth out price variations, which helps traders to differentiate between trend direction and market “noise”. As a general rule, if price action consistently stays above the moving average, the market is in an uptrend; if it stays below, it signals a downtrend.
There are two primary types to know:
- Simple Moving Average (SMA): The most basic calculation, providing the mean price over a set period.
- Exponential Moving Average (EMA): Assigns more weight to recent prices, making the line much more reactive to sudden market shifts.
Using Moving Averages to Identify Trends for Entry and Exit Points
Beyond just spotting the direction of the market, a moving average can act as dynamic support or resistance. Traders often look for buying opportunities when the price pulls back down to the moving average during an uptrend, or selling opportunities when the price rallies up to the moving average during a downtrend.
Golden and Death Crosses: What They Are and How to Identify Them?
If you are searching for a strong trend indicator on TradingView, analysing moving average crossovers is a highly effective technique.
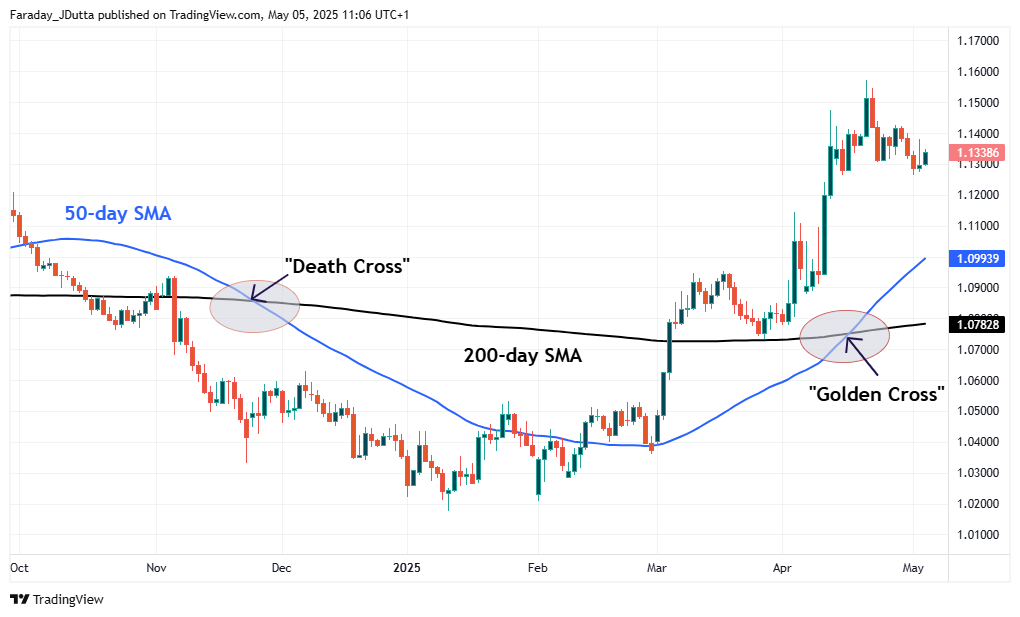
- The Golden Cross (Bullish): This occurs when a shorter-term moving average (typically the 50-day) crosses above a longer-term moving average (like the 200-day). This is widely viewed as a buy signal, indicating the market is shifting from a downtrend into a new uptrend.
- The Death Cross (Bearish): The exact opposite. It happens when the 50-day crosses below the 200-day, indicating a potential transition from an uptrend into a long-term downtrend.
Multi-Timeframe Moving Average Crossover Strategy
Adding indicators to TradingView allows you to overlay multiple moving averages on a single chart for clearer, more reliable signals.
A shorter-term MA reacts quickly to daily price changes, while a longer-term MA is slower and less sensitive to short-term spikes. By combining them—for example, pairing a 20-day EMA with a 50-day SMA—traders can observe the interaction between fast and slow price action, helping them interpret trend patterns much more effectively.
MACD: What It Is and How to Use It to Support Trading Decisions
The MACD (Moving Average Convergence / Divergence) is a trend-following momentum oscillator used to identify where the market is heading and how fast it is getting there.
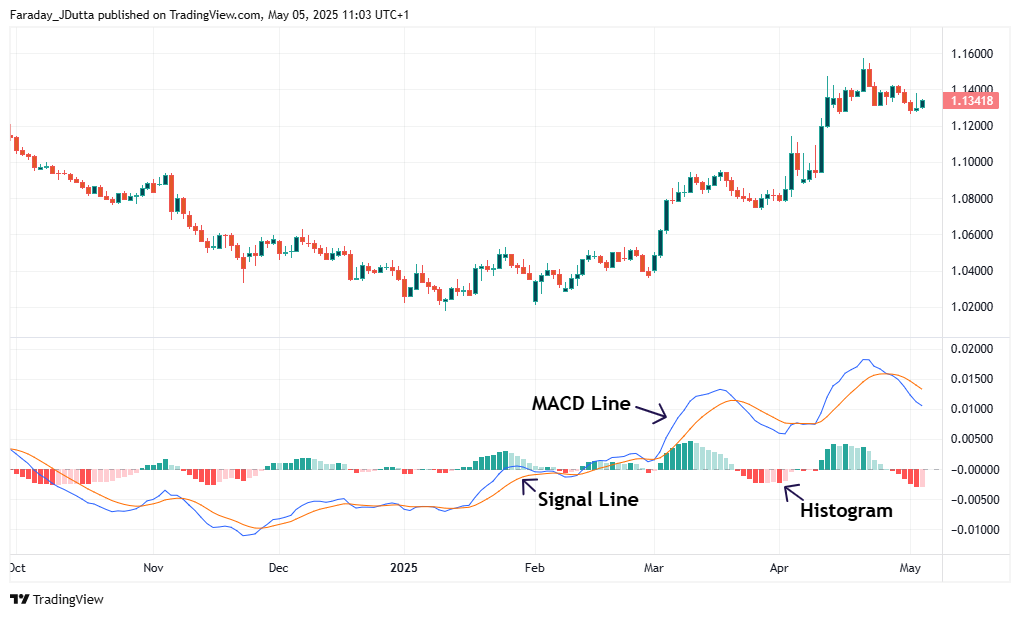
The tool is made up of three distinct visual components:
- The MACD Line: This line calculates the difference between two exponential moving averages (EMAs) to measure whether bullish or bearish momentum is strengthening or weakening.
- The Signal Line: This is a moving average of the MACD line itself, making it slower to react and smoother.
- The Histogram: This bar chart displays the exact difference between the MACD line and the Signal Line, providing a visual representation of momentum shifts.
MACD – Key Histogram Interpretations
- Positive Values
When the histogram is positive (i.e. above the baseline), that means that the MACD is higher than its nine-day average. That indicates a recent increase in upward momentum.
- Negative Values
When the histogram is negative (i.e. below the baseline), that means that the MACD is lower than its nine-day average. That indicates a recent decrease in upward momentum.
- Zero Crosses
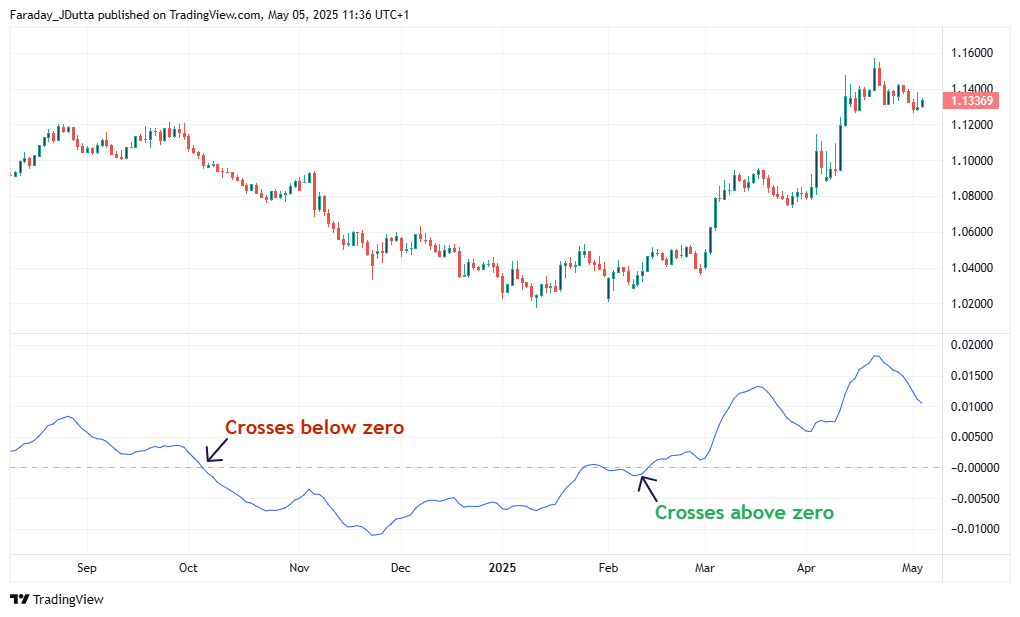
When the MACD line crosses above zero, it is generally viewed as a bullish signal. Conversely, a cross below zero is seen as bearish. Some traders also look for the Signal Line to cross the zero line as an additional point of confirmation.
- Histogram Reversals
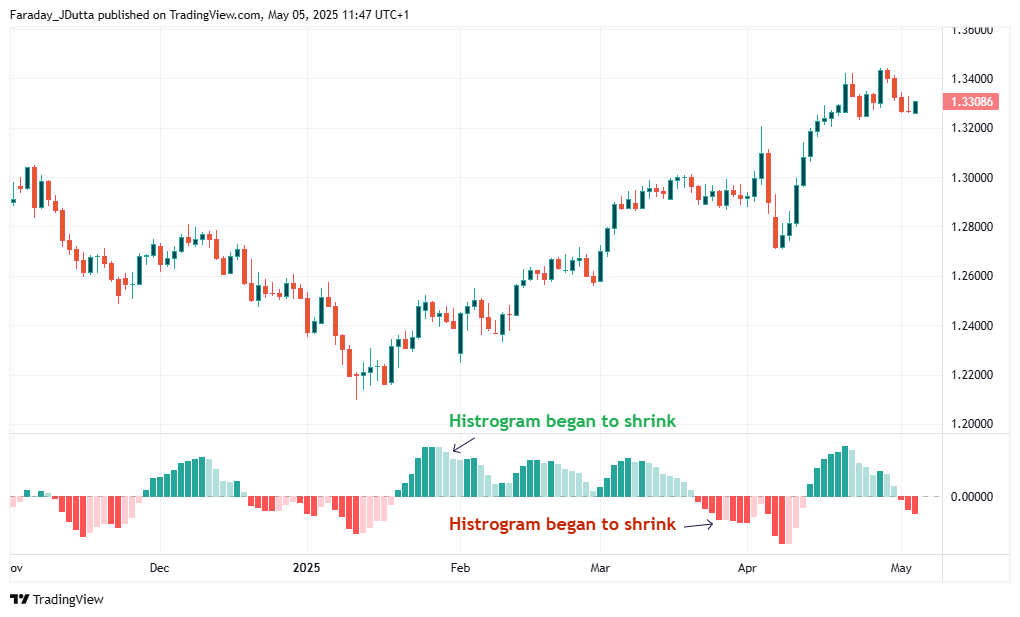
The histogram represents the difference between the MACD line and the Signal Line. As these two lines diverge—indicating stronger price momentum—the histogram moves further away from the zero line and increases in height.
When the histogram begins to contract, it may signal that momentum, whether bullish or bearish, is starting to weaken.
- Divergence & Divergence Spotting
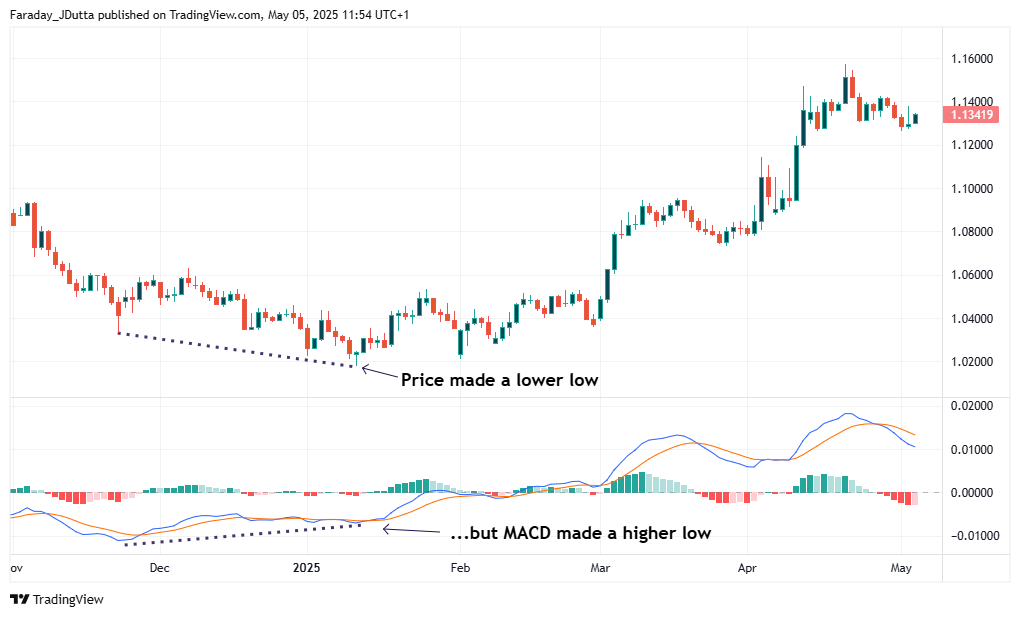
Divergence between the MACD and the price can be a significant signal. Typically, when the price forms a higher high or a lower low, the MACD is expected to do the same. Both should generally move in the same direction. When they do not, this divergence may indicate a potential shift in the current trend.
Because this is such a powerful predictive concept, many traders specifically set up a TradingView MACD divergence indicator to highlight these exact discrepancies, giving them an early warning of a potential trend reversal before the rest of the market reacts.
How to Combine These Indicators on TradingView
Combining indicators can make your trading strategies more robust, especially in different market conditions and when prices are volatile. This may mean false signals are avoided. This might be especially useful during the current trading environment, when price action is very choppy, and there is a lot of two-way price action.
Identify Combined Indicators with Pre-Built Scripts
A trading strategy is to pair a strong trend indicator on TradingView with a momentum oscillator. For example, combining an MA indicator on TradingView (to determine the overall trend) with the TradingView RSI (to pinpoint overbought/oversold entries) offers a much more balanced view of the market. Where possible, test these combinations in advance to ensure you are familiar with how they react together.
Add Indicators to Your Charts Manually
If you want to build your own custom setup, adding indicators to TradingView manually is incredibly straightforward. You can easily layer multiple tools on a single screen. This user-friendly interface, along with the ease of editing or hiding tools with a single click, is a major reason for TradingView’s popularity among global traders.
Customisation and Analysis
The enduring appeal of TradingView is also its easy customisation of any technical indicator. Traders can adjust technical indicators to suit their preferred strategies and trading styles, allowing them to explore, experiment, and refine their analysis with greater flexibility.
Avoiding Conflicting Signals
While combining tools is powerful, using too many can lead to “analysis paralysis.” You might encounter conflicting signals—for instance, a moving average pointing to an uptrend while an oscillator screams “sell.” To combat this, keep your charts clean, stick to 2 or 3 complementary indicators, and always test your specific setup in a live or demo trading environment to see how the signals perform under real market conditions.
Start Testing Using TradingView Indicators
Technical indicators play a vital role in helping traders analyse price action, identify trends, and make more informed decisions. From momentum tools like the TradingView RSI to trend-based setups, each offers unique insights depending on your strategy, timeframe, and the market being traded.
The real edge in trading comes from exploring different combinations. For example, pairing an MA indicator on TradingView with the RSI can significantly refine your approach and filter out false signals. Testing these combinations in a risk-free environment is a practical step toward building confidence in your system.
Open a live account with Vantage today to explore how TradingView indicators can be used together and identify which combinations best suit your trading style.
RISK WARNING: CFDs are complex financial instruments and carry a high risk of losing money rapidly due to leverage. You should ensure you fully understand the risks involved and carefully consider whether you can afford to take the high risk of losing your money before trading.
Disclaimer: The information is provided for educational purposes only and doesn’t take into account your personal objectives, financial circumstances, or needs. It does not constitute investment advice. We encourage you to seek independent advice if necessary. The information has not been prepared in accordance with legal requirements designed to promote the independence of investment research. No representation or warranty is given as to the accuracy or completeness of any information contained within. This material may contain historical or past performance figures and should not be relied on. Furthermore estimates, forward-looking statements, and forecasts cannot be guaranteed. The information on this site and the products and services offered are not intended for distribution to any person in any country or jurisdiction where such distribution or use would be contrary to local law or regulation.