Headline havoc causes whippy markets
Jamie Dutta >
Market Analyst
Jamie Dutta >
Market Analyst
Jamie Dutta is a Market Analyst for Vantage. He comes with extensive experience as a full-time trader and financial market commentator, having worked as a trader in top tier investment banks and trading houses.

* Signs that Iran is preparing to mine the Strait of Hormuz
* Oil choppy sharply lower and then modestly higher on the day
* Stocks oscillate with oil as markets try to keep with Middle East
* Dollar holds minor gains as conflict uncertainty persists
FX: USD softened and then gained small as the index moved off the 100-day SMA at 98.56. A major Fib retracement level of the November to January move sits at 98.54 with the downward trendline from the November highs also in play at the moment. Below is the 200-day SMA at 98.33 and the 50-day at 97.99. We are obviously all still watching crude prices, any oil flows through the strait of Hormuz and headlines on any earlier cessation of military action. There were conflicting stories through the day, though the general direction of travel appeared to be falling oil prices until stories about Iran mining the Strait of Hormuz. The January 2025 high at $81.80 in Brent, which capped the upside briefly last week, acted as support.
EUR built on its gains from Monday’s bullish outside day and headed towards its 200-day SMA at 1.1671 before paring gains. The 100-day is above here at 1.1693. The single currency has been a relative underperformer but any sooner than anticipated easing in geopolitical tensions could boost the euro. The risk of rate hikes did get reined in as ECB officials cautioned against an overreaction to recent events.
GBP outperformed most of its peers and rose above the 200-day SMA at 1.3441. The midpoint of the November to January low to high move sits at 1.3439 with the 50-day SMA at 1.3524. The outside day on Monday was bullish. Rate hike pricing, that had replaced cuts in recent days, have been erased with the possible ending of the war sooner than expected. Yield spreads still offer fundamental support to sterling.
JPY gave back gains towards the end of the session. There were several domestic data including Q4 GDP revisions that either matched or exceeded the preliminary numbers, while household spending surprisingly contracted. There is some chatter about the prospect of a June hike, which is a softening in recent talk around a move in April. Monday’s candle was a shooting star doji, and a potential rejection of higher prices.
US stocks: The S&P 500 lost 0.21% to close at 6,781, the Nasdaq was 0.04% lower at 24,956 and the Dow Jones settled lower by 0.07% at 47,706. All sectors were in the red, except Tech and Communication Services. Energy, Healthcare and Utilities were the biggest laggards. Oracle climbed after hours after better than expected earnings and a robust long-term revenue forecast, as it continues to pursue its big bets on AI data centres. Strong sales data from TSMC supported by AI infrastructure demand before the Middle East conflict saw Micron and Intel outperform. The flip side saw defence contractors like Lockheed Martin slide.
Asian stocks: Futures are green. APAC stocks were positive as risk sentiment improved on the back of potential G7 oil reserves being released and President Trump’s calmer tone. The ASX 200 rallied with miners, materials and tech leading. The Nikkei 225 reclaimed 54,000 as exporters cheered the pullback in energy prices. The Hang Seng and Shanghai Comp rose though lagged their regional peers after reports the Us and China clashed over tariffs and fentanyl.
Gold looked to have broken to the upside after consolidating around $5,100 in recent days. The softer dollar and bond yields, with inflation worries modestly easing have helped bugs the next resistance sits at the early March highs around $5,400.
Day Ahead – US CPI
We get a double dose of US inflation data this week just as the Middle East turmoil raises fresh doubts about the Federal Reserve’s rate cut plans. The data won’t capture this week’s oil and gas price spikes as they are pre-conflict numbers but should still make for interesting reading. The headline print is forecast at 0.2% m/m and 2.5% y/y, and the core at 0.3% m/m and 2.4% y/y. Goods prices may keep some upward pressure from tariffs, but softer shelter costs are expected to offset this. The conflict has since made officials more cautious about endorsing further policy loosening. While they have previously suggested they can look through one-off price jumps, the situation remains fluid with the duration of the conflict and, by extension, its medium-term impact on energy prices and supply chains still key. Ultimately, it means markets may look through this report. There’s around 39bps of rate cuts priced in currently for 2026.
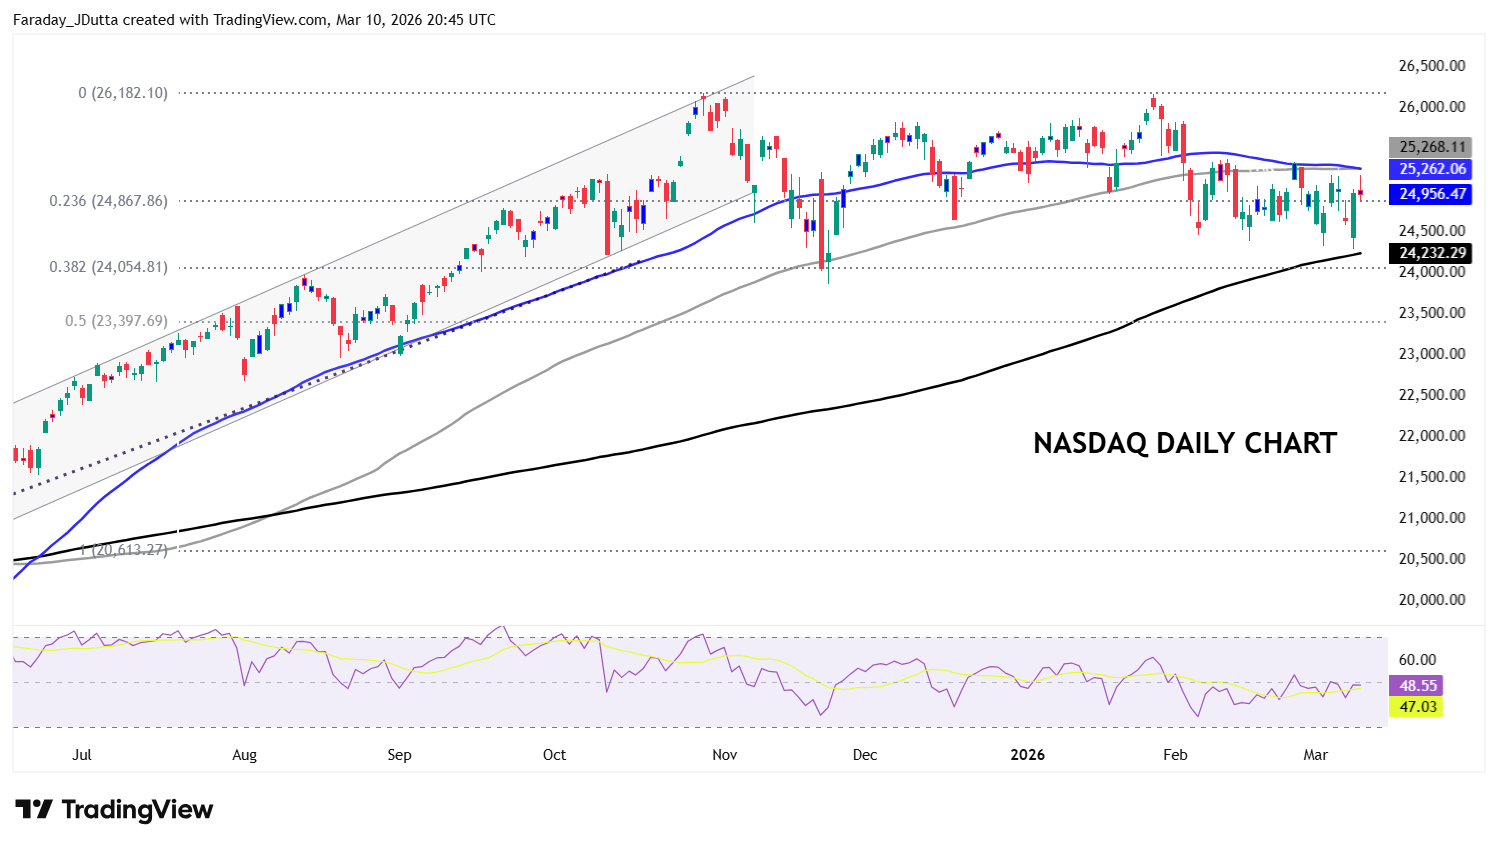
Chart of the Day – Nasdaq outperforms
While stocks haven’t been hit as hard as many expected, US equities have outperformed European and Asian stocks in the past couple of weeks. Sector performance too has rotated again with energy-hungry industrials and material sectors falling after a great run, more than technology stocks. Notably too, defensive sectors like healthcare and staples did not get a boost from any haven flows. Instead, tech has taken the lead, and unlike HALO (heavy asset, low obselescence) companies, tech firms are typically immune to both commodity shocks and trade disruptions. The Nasdaq got close to the 200-day SMA at 24,233 before bouncing. Prices are back above a minor Fib level with the 50-day and 100-day SMAs above at 25,262/8.